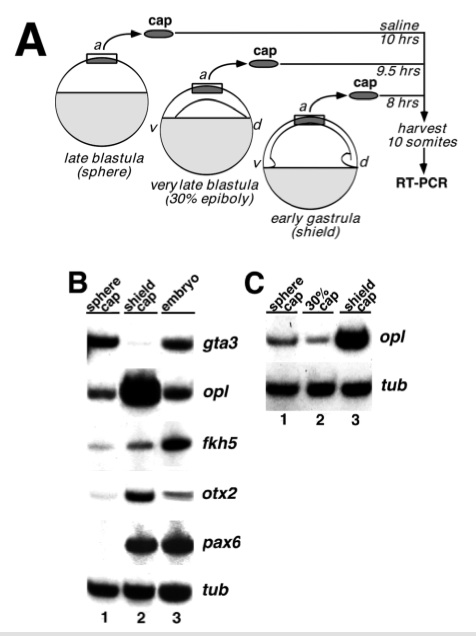
Fig. 4 Explant assays show that neural specification occurs by early gastrula. (A) Schematic outline of the explant assay. Animal caps were explanted from sphere stage, 30% epiboly stage,or shield stage embryos. Caps were combined in groups of 5-10 and cultured until control embryos reached mid-somitogenesis, when they were assayed by a reverse transcriptase-PCR (RT-PCR) assay for expression of marker genes, as described in Materials and Methods. (B) RT-PCR analysis of gene expression in animal cap explants. The following markers were assayed: gta3 (Neave et al., 1995), a marker of ventral ectoderm; opl, a marker of prospective telencephalon; fkh5, a marker ofprospective diencephalon, mesencephalon and spinal cord; otx2 (Li et al., 1994), a marker of prospective telencephalon, diencephalon, and mesencephalon; pax6 (Krauss et al., 1991), a marker of prospective diencephalon, hindbrain and spinal cord, and α-tubulin (G. Conway, personal communication), a loading control. Each lane represents a pool of five explants. The data shown here is representative of 2 experiments each for gta3, otx2 and pax6, 3 experiments for fkh5 and 5 experiments for opl. Lane 1: explants from sphere stage embryos; lane 2: explants from shield stage embryos; lane 3: whole embryo controls. (C) RT-PCR analysis of opl expression in animal cap explants from a later blastula stage. Dissections were done as in A using embryos at 30- 35% epiboly. Lane 1: explants from sphere stage embryos; lane 2: explants from 30-35% epiboly stage embryos; lane 3: explants from shield stage embryos.
Image
Figure Caption
Acknowledgments
This image is the copyrighted work of the attributed author or publisher, and
ZFIN has permission only to display this image to its users.
Additional permissions should be obtained from the applicable author or publisher of the image.
Full text @ Development

