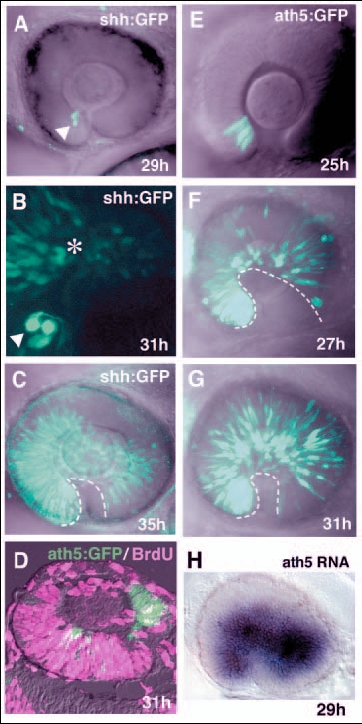
Fig. 5 Pattern of progression of shh:GFP and ath5:GFP expression in zebrafish retina. (A-C) Lateral view of the optic cup of the transgenic line Tg(shh:GFP). B is shown at twice the magnification of A and C. shh:GFP is expressed in a few cells adjacent to the optic stalk at 29 hpf (A, white arrowhead). Progression of GFP expression is observed in the adjacent dorsal region at 31 hpf (B, asterisk). A wave front of shh:GFP expression reaches the temporal region of the neural retina at 35 hpf (C, dotted line). (D) Double labelling of 31-hpf retinas of the transgenic line Tg(ath5:GFP) with the anti-BrdU antibody and ath5:GFP antibody. ath5:GFP-positive cells (green) are BrdU (magenta) negative. (E-G) GFP expression in the transgenic line Tg(ath5:GFP). Throughout the stages examined, the pattern of ath5:GFP expression is similar to that of ath5 transcription. Note that GFP-expressing cells are already observed in the temporal region at 27 hpf (F), and the density of GFP-positive cells increases in later stages (G). The dotted line indicates a wave front of ath5:GFP expression. (H) ath5 RNA expression in the transgenic line Tg(shh:GFP) at 29 hpf. This is the same embryo that is shown in A. ath5 expression spreads to the large region of the neural retina.
Image
Figure Caption
Acknowledgments
This image is the copyrighted work of the attributed author or publisher, and
ZFIN has permission only to display this image to its users.
Additional permissions should be obtained from the applicable author or publisher of the image.
Full text @ Development

