
Fig. 3
- ID
- ZDB-FIG-241219-20
- Publication
- Lee et al., 2024 - CXCR3-CXCL11 Signaling Restricts Angiogenesis and Promotes Pericyte Recruitment
- Other Figures
- All Figure Page
- Back to All Figure Page
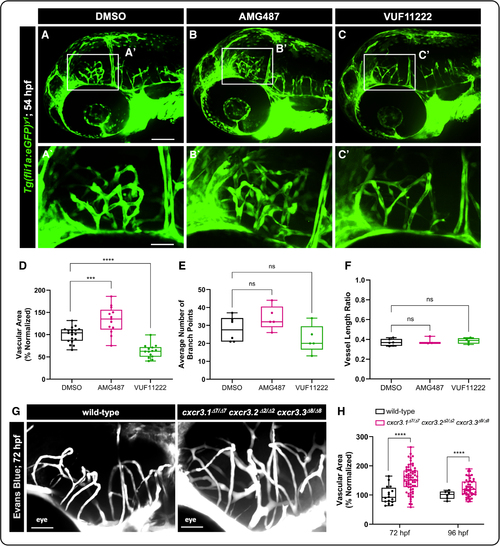
CXCR3 (CXC motif chemokine receptor 3) contributes to cranial angiogenesis in the developing zebrafish. A through C, Representative images of Tg(fli1a:GFP) zebrafish treated with dimethyl sulfoxide (DMSO) vehicle control (A), the Cxcr3 antagonist (AMG487; B), or the Cxcr3 agonist (VUF11222; C). Pharmacological reagents were added to the zebrafish water at 32 hpf, and embryos were imaged at 54 hpf to view changes in vascularization. A? through C?, Magnified insets. Scale bars=500 �m (A?C) and 50 �m (A??C?). D, Quantification of the vascular area, normalized to the DMSO control (n=19 DMSO, n=13 AMG487, and n=14 VUF11222). E, Average number of endothelial cell (EC) vessel branch points in the frontal lobe of the zebrafish brain (the region shown in the images; n=6 DMSO, n=5 AMG487, and n=5 VUF11222). F, Average vessel length. To account for any changes in mounting angle of the samples, a vessel length ratio was calculated by measuring the length of each vessel and then dividing by the distance from the top of the eye to the top of the skull for each fish (n=6 DMSO, n=3 AMG487, and n=4 VUF11222). G, Representative confocal images of cranial vascular networks at 72 hpf in wild-type or homozygous cxcr3.1?7/?7 cxcr3.2?2?2 cxcr3.3?8?8 triple mutant animals. Scale bar=250 �m. H, Quantification of the vascular area normalized to the wild-type control average (n=16 wild-type 72 hpf, n=67 triple mutant 72 hpf, n=6 wild-type 96 hpf, and n=49 triple mutant 96 hpf). For D, E, F, and H, each dot represents an individual zebrafish. One outlier was identified and removed from the VUF11222 group in D as per the ROUT method (Q=1%). Statistics for D, E, and F were calculated using 1-way ANOVA with Dunnett multiple comparisons test. H was analyzed with 2-way ANOVA with Sidak multiple comparisons. Omnibus ANOVA P values (before the post hoc tests) are <0.0001 (D), 0.0649 (E), 0.729 (F), and <0.0001 (H). Data are presented as box plots that display the median value with first and third quartiles and min/max bars. ***P<0.0005, ****P<0.0001. P>0.05 (ns). |