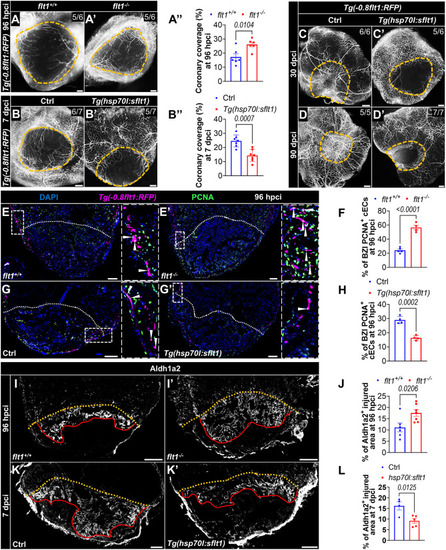
Flt1 regulates endothelial regeneration. (A-B″) Whole-mount images of cryoinjured ventricles from Tg(-0.8flt1:RFP);flt1+/+ (n=6, A) and Tg(-0.8flt1:RFP);flt1−/− (n=6, A′) zebrafish, and from Tg(-0.8flt1:RFP) (Ctrl, n=7, B) and Tg(-0.8flt1:RFP);Tg(hsp70l:sflt1) (n=7, B′) zebrafish showing revascularization of the injured area at 96 hpci (A,A′) and 7 dpci (B,B′), and the corresponding percentage of coronary coverage of the injured area (A″,B″). (C-D′) Whole-mount images of cryoinjured ventricles from Tg(-0.8flt1:RFP) (Ctrl, C,D) and Tg(-0.8flt1:RFP);Tg(hsp70l:sflt1) (C′,D′) zebrafish showing revascularization at 30 dpci (C,C′) and 90 dpci (D,D′). (E,E′,G,G′) Immunostaining for RFP (cECs, magenta) and PCNA (proliferation marker, green) with DAPI (blue) counterstaining on sections of cryoinjured ventricles from Tg(-0.8flt1:RFP);flt1+/+ (n=5, E) and Tg(-0.8flt1:RFP);flt1−/− (n=4, E′) zebrafish, and from Tg(-0.8flt1:RFP) (Ctrl, n=4, G) and Tg(-0.8flt1:RFP);Tg(hsp70l:sflt1) (n=4, G′) zebrafish at 96 hpci. Arrowheads indicate PCNA+ cECs. Areas outlined are shown at higher magnification on the right. (F,H) Percentage of PCNA+ cECs in the border zone and injured area (BZI) of the indicated genotypes at 96 hpci. (I,I′,K,K′) Immunostaining for Aldh1a2 (activated endocardium, white) on sections of cryoinjured ventricles from flt1+/+ (n=6, I) and flt1−/− (n=7, I′) zebrafish at 96 hpci, and from non-transgenic Ctrl (n=4, K) and Tg(hsp70l:sflt1) (n=5, K′) zebrafish at 7 dpci. Red lines indicate the extent of activated endocardium in the injured area. (J,L) Percentage of Aldh1a2+ injured area from the indicated genotypes. Orange and white dotted lines indicate the injured area. Scale bars: 100 µm. Data are mean±s.e.m. (two-tailed, unpaired Student's t-test with P values shown in the graphs).
|