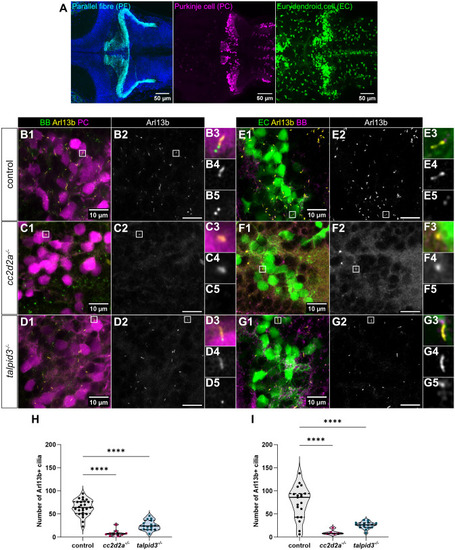
Loss of primary cilia in cerebellar neurons of cc2d2a and talpid3 mutants. (A) Representative whole-mount maximum projection confocal immunofluorescence images showing parallel fibres of granule cells (anti-Vglut1 – cyan), Purkinje cells (anti-Pvalb7 – magenta) and olig2+ eurydendroid cells [Tg(olig2:EGFP) transgenic line – green] in the cerebellum of wild-type zebrafish larvae at 5 dpf. Images show a dorsal view with anterior to the left. (B-G) Whole-mount maximum projection confocal immunofluorescence images showing primary cilia labelled with the Tg(ubi:Arl13b-mCherry) transgenic line (Arl13b – yellow) and basal bodies (BB – green) labelled using anti-γ-Tubulin (C,E-G) or using the Tg(β-actin:GFP-centrin) transgenic line (B,D). Purkinje cells (PC – magenta) are marked using anti-Pvalb7 (B-D) and eurydendroid cells (EC – green) are marked by the Tg(olig2:EGFP) transgenic line (E-G). Note the strong decrease in cilia numbers in both mutants (cc2d2a−/− in C and F; talpid3−/− in D and G) compared to control (B and E). Insets show a magnified view of one representative cilium [from top to bottom: composite image (B3-G3), Arl13b (B4-G4) and BB (B5-G5)]. Images show a dorsal view of 5 dpf larvae with anterior to the left. Scale bars: 10 µm. (H-I) Violin plots showing a statistically significant reduction in Arl13b+ cilia within the mutant Purkinje cell layer (H) and olig2+ eurydendroid cell layer (I) compared to controls. Each data point represents one larva, and violin plot represents median (thick line) and quartiles (dashed line). ****P≤0.0001. Welch's ANOVA with post-hoc Dunnett's T3 multiple comparisons test. For Purkinje cell analysis, control n=25 (N=5), cc2d2a−/−n=10 (N=3), talpid3−/−n=15 (N=2) larvae. For eurydendroid cell analysis, control n=23 (N=4), cc2d2a−/−n=8 (N=2), talpid3−/−n=16 (N=2) larvae. N denotes the number of independent experiments (i.e. larvae from independent clutches) used for analysis. Analyses were carried out using mz cc2d2a−/− and zygotic talpid3−/− mutants.
|
