
Fig. 5
- ID
- ZDB-FIG-241104-34
- Publication
- Song et al., 2024 - Thymosin β4 promotes zebrafish Mauthner axon regeneration by facilitating actin polymerization through binding to G-actin
- Other Figures
- All Figure Page
- Back to All Figure Page
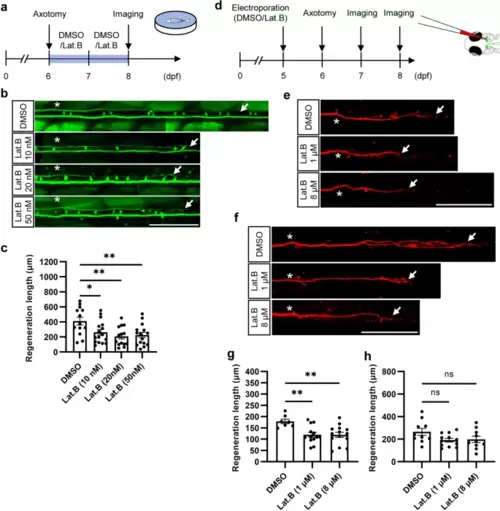
Lat. B inhibits axon regeneration in zebrafish. a Experimental workflow for the immersion method used to treat zebrafish larvae, with daily replacement of fresh drug after axon injury. b and c Representative images (b) and statistical analysis (c) of axon regeneration in zebrafish larvae treated with different concentrations of Lat. B (DMSO, 412.3 � 51.4 ?m, n = 13; Lat. B (10 nM), 261.5 � 37.2 ?m, n = 16; Lat. B (20 nM), 207.2 � 34.3 ?m, n = 14; Lat. B (50 nM), 225.1 � 36.5 ?m, n = 15). Assessed by one-way ANOVA/Dunnett's multiple comparisons test (Lat. B (10 nM), adjusted p = 0.027; Lat. B (20 nM), adjusted p = 0.0025; Lat. B (50 nM), adjusted p = 0.0053). The asterisks indicate the sites of injury, and the arrows indicate the terminals of the regenerated axon. Scale bar, 100 ?m. d Experimental workflow for single-cell drug treatment. e and g Representative images (e) and statistical analysis (g) of axon regeneration 24 hpi in zebrafish larvae treated with different concentrations in single cells (DMSO, 179.0 � 10.3 ?m, n = 7; Lat. B (1 ?M), 119.5 � 10.9 ?m, n = 13; Lat. B (8 ?M), 119.2 � 11.4 ?m, n = 14). Assessed by one-way ANOVA/Dunnett's multiple comparisons test (Lat. B (1 ?M), adjusted p = 0.0047; Lat. B (8 ?M), adjusted p = 0.0040). The asterisks indicate the sites of injury, and the arrows indicate the terminals of the regenerated axon. Scale bar, 100 ?m. f and h Representative images (f) and statistical analysis (h) of axon regeneration at 48 hpi in zebrafish larvae treated with different concentrations of Lat. B at the single-cell level. (DMSO, 264.6 � 31.2 ?m, n = 10; Lat. B (1 ?M), 191.1 � 16.4 ?m, n = 12; Lat. B (8 ?M), 197.9 � 27.5 ?m, n = 10). Assessed by one-way ANOVA/Dunnett's multiple comparisons test (Lat. B (1 ?M), adjusted p = 0.077; Lat. B (8 ?M), adjusted p = 0.13). The asterisks indicate the sites of injury, and the arrows indicate the terminals of the regenerated axon. Scale bar, 100 ?m |