FIGURE

Fig. 2

ID
ZDB-FIG-241023-70
Publication
Baranykova et al., 2024 - Loss of Stim2 in zebrafish induces glaucoma-like phenotype
Other Figures
All Figure Page
Back to All Figure Page
Fig. 2

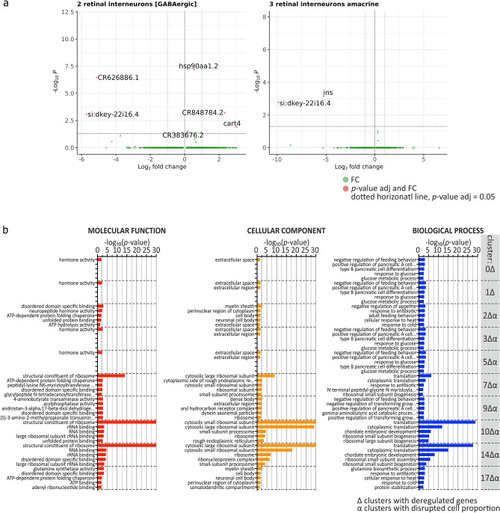
Differentially expressed genes in different clusters in stim2 KO zebrafish and the GO analysis. (a) Volcano plots of differentially expressed genes in clusters 2Δ and 3Δ. Genes significantly deregulated in each cluster are labeled. Horizontal dotted line indicates p-value adjusted = 0.05; green dot represent genes with not-significantly changed expression; red dots represent genes with significantly changed expression (p-value adjusted < 0.05 and log2 fold change (FC) different from 0). (b) Gene Ontology enrichment analysis of DEGs showing molecular function (red bars), cellular component (orange bars), and biological process (blue bars) aspects of 10 clusters with DEGs. All GO terms are presented for p < 0.05 (Fisher’s test). Up to five GO terms are presented for each cluster. Δ, clusters with dysregulated genes identified; α, clusters with dysregulated proportion of cells.

Expression Data

Expression Detail
Antibody Labeling
Phenotype Data

Phenotype Detail
Acknowledgments
This image is the copyrighted work of the attributed author or publisher, and ZFIN has permission only to display this image to its users. Additional permissions should be obtained from the applicable author or publisher of the image. Full text @ Sci. Rep.