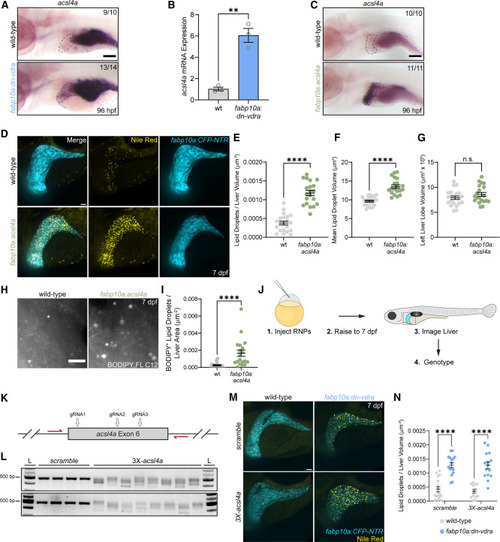
acsl4a overexpression is induced by Vdr impairment and causes hepatic steatosis (A) In situ hybridization for acsl4a at 96 hpf. Liver is indicated with a dashed line. The number of individuals resembling the representative image is noted in each image. Scale bar, 100 μm. (B) RT-qPCR analysis of acsl4a expression from FACS-purified hepatocytes collected at 7 dpf. Each sample represents hepatocytes from approximately 35 larvae. Unpaired two-tailed t test. n = 3 per group. (C) In situ hybridization for at 96 hpf. The liver is indicated with a dashed line. The number of individuals resembling the representative image is noted in each image. Scale bar, 100 μm. (D) Analysis of hepatic steatosis and liver size in fabp10a:CFP-NTR larvae following Nile red staining at 7 dpf. Scale bar, 30 μm. (E) Liver lipid droplets per liver volume. (F) Mean lipid droplet volume. (G) Left liver lobe volume. (E–G) Unpaired two-tailed t test. n = 21 WT, 20 dn-vdra. (H) Maximum intensity projections illustrating hepatic fatty acid storage following 3-h BODIPY FL C12 pulse. Scale bar, 10 μm. (I) BODIPY FL C12+ lipid droplets per liver area. Two-tailed Mann-Whitney test. n = 15 WT, 19 acsl4a. (J) Schematic of the F0 CRISPR mutagenesis experiment to assess the necessity of acsl4a in dn-vdra-induced steatosis. (K) Schematic of acsl4a exon 6 targeted with 3 CRISPR guide RNAs and flanked by PCR primers (red arrows). (L) Representative gels of acsl4a exon 6 PCR products following injection of RNPs containing a non-targeting scramble CTRL guide or 3 pooled gRNAs targeting acsl4a. L, ladder. (M) Analysis of hepatic steatosis in fabp10a:CFP-NTR larvae injected with CTRL or acsl4a-targeting RNPs and stained with Nile red at 7 dpf. Scale bar, 30 μm (N) Liver lipid droplets per liver volume. Two-way ANOVA with Sidak’s multiple comparison test. n = 17 WT.scramble, 13 WT.acsl4a, 16 dn-vdra.scramble, 15 dn-vdra.acsl4a. Error bars are mean + SEM. ∗∗p < 0.01, ∗∗∗p < 0.001. See also Figure S4 .
|
