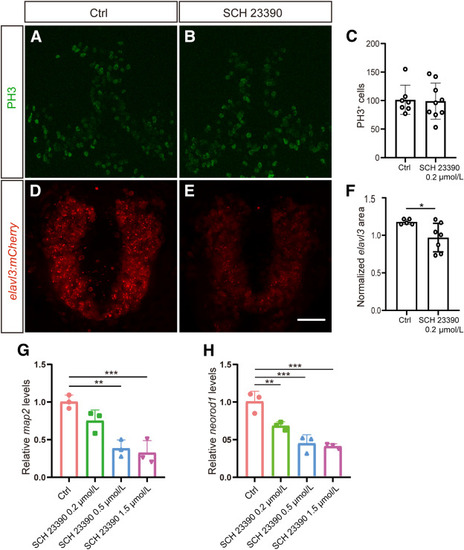
Disrupted dopaminergic signaling during development affects neuronal specification but not cell proliferation. A and B: Immunofluorescence images showing the expression of phosphorylated histone H3 (PH3) in the control group (A) and the drug-treated group (B). PH3 is a marker for mitotic cells. C: Quantification of the number of PH3+ cells in the control and drug-treated groups. The comparison between the control (Ctrl) and SCH 23390 groups for PH3 number was conducted using an unpaired t-test, revealing no significant difference (P = 0.8712). D and E: Live imaging of Tg(elavl3:mCherry), elavl3 is a pan-neuronal marker, in the forebrain of the control and SCH 23390?treated group. F: Significant differences in normalized elavl3 area were observed between the control and SCH 23390 groups (t = 2.399, df = 10, P = 0.0374, unpaired t-test). Data are presented as means � SD. n = 7 (Ctrl) and 9 (SCH 23390 0.2 ?mol/L) (C and F?H). G and H: Quantitative real-time PCR revealed mRNA levels of two neuronal markers map2 and neurod1. ?P < 0.05, ??P < 0.01, ???P < 0.001. Scale bar = 50 ?m.
|
