|
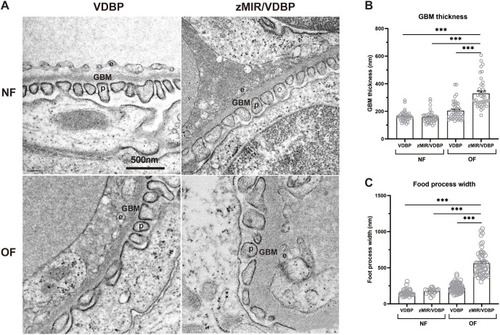
Overfed zMIR/VDBP zebrafish develop thick glomerular basement membranes. (A) Representative transmission electron microscopy images of the glomerular basement membrane (GBM) and foot processes of the four groups. The podocytes (p), endothelium (e) and GBM are marked on the images. Scale bar: 500 nm. (B) Summary of the GBM thickness of the four groups of zebrafish. GBM thickness was measured at ten randomly assigned points in each image from four fish/group. (C) Foot process width analysis revealed that foot process effacement was present in overfed zMIR/VDBP fish. At least 20-70 podocyte foot processes were measured in each group. Data are presented as mean±s.e.m. ***P<0.001; Bonferroni–Dunn multiple comparisons test.
|