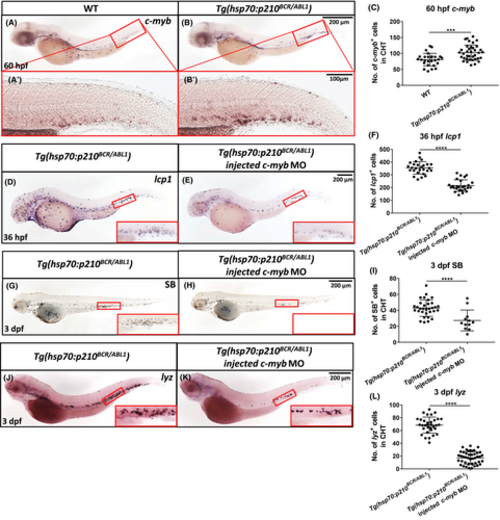
The impact of BCR/ABL1 on neutrophil regulation depends on c-myb. (A,B), (A?,B?) WISH showed an increase of c-myb expression in Tg(hsp70:p210BCR/ABL1) (B,B?) at 60 hpf compared with controls (A,A?). Red boxes showed enlarged details. (C) Quantification of numbers of 60 hpf c-myb+ cells in caudal hematopoietic tissue (CHT) (WT, n = 27; Tg(hsp70:p210BCR/ABL1), n = 37). (D,E) WISH showed a decrease of lcp1 expression in Tg(hsp70:p210BCR/ABL1) injected c-myb antisense oligonucleotide morpholino (MO) at 36 hpf. (F) Quantification of numbers of 36 hpf lcp1+ cells (Tg(hsp70:p210BCR/ABL1), n = 27; Tg(hsp70:p210BCR/ABL1) injected c-myb MO, n = 26). (G,H) SB staining showed decreased number of SB+ cells in Tg(hsp70:p210BCR/ABL1) injected c-myb MO at 3 dpf. Red boxes showed enlarged detail of SB+ cells in each group. (I) Quantification of numbers of 3 dpf SB+ cells in CHT (Tg(hsp70:p210BCR/ABL1), n = 32; Tg(hsp70:p210BCR/ABL1) injected c-myb MO, n = 12). (J,K) WISH showed a decrease of lyz expression in Tg(hsp70:p210BCR/ABL1) injected c-myb MO at 3 dpf. Red boxes showed enlarged detail of lyz+ cells in each group. (L) Quantification of numbers of 3 dpf lyz+ cells (Tg(hsp70:p210BCR/ABL1), n = 33; Tg(hsp70:p210BCR/ABL1) injected c-myb MO, n = 45). Scale bars, 200 ?m (A, B, D, E, G, H, J, K) and 100 ?m (A?,B?).
|
