Fig. 3
- ID
- ZDB-FIG-240517-7
- Publication
- Scala et al., 2023 - Biallelic loss-of-function variants in CACHD1 cause a novel neurodevelopmental syndrome with facial dysmorphism and multisystem congenital abnormalities
- Other Figures
- All Figure Page
- Back to All Figure Page
|
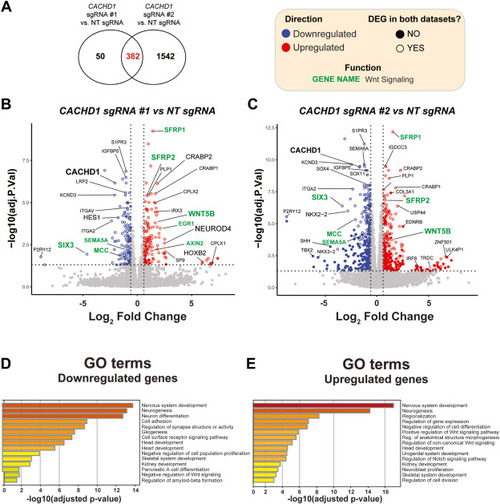
Genetic ablation of CACHD1 affects expression of key neurodevelopmental genes and signaling pathways. A. Venn diagram depicting the overlap of differentially expressed genes (DEGs) between the 2 CACHD1-depleted NPC lines. B, C. Volcano plots of DEGs, comparing each CACHD1-depleted line with NT control. Open circles reflect DEGs consistent in both CACHD1-depleted lines relative to NT control. Positive mean log2 fold change (FC) refers to genes that are upregulated in CACHD1-edited cells. Statistical significance is defined as Benjamini-Hochberg adjusted P values < .05. Vertical dashed lines represent log2FC = 0.6 (FC ? 1.5 fold), whereas horizontal dashed lines represent the adjusted P value threshold of P < .05. DEGs that pass both the significance and FC thresholds are colored in red (upregulated) or blue (downregulated). Genes in green are known Wnt pathway genes. D, E. Gene Ontology (GO) term analysis of 382 DEGs; (D) downregulated and (E) upregulated genes in CACHD1-depleted lines. |

