|
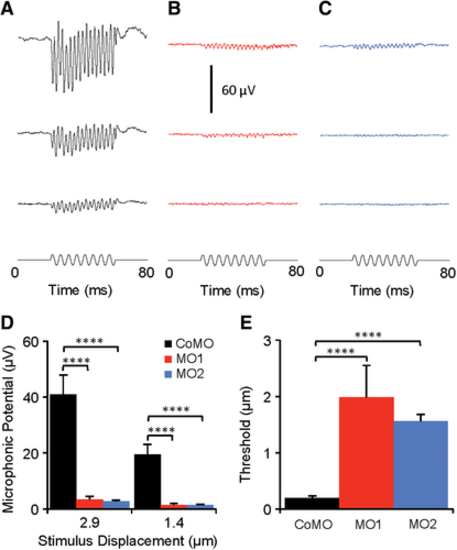
Hearing loss in MO1 and MO2 morphants. (A, B, C) Examples of microphonic response waveforms from CoMO, MO1, and MO2 morphants at 3 dpf in response to 200-Hz vibrating stimuli at three stimulus displacement levels (2.9, 1.4, and 0.7 ?m from top to bottom). (D) Comparisons of microphonic amplitude at two stimulus displacements (2.9 and 1.4 ?m) among CoMO, MO1, and MO2 fish, showing significant reductions in microphonic amplitude for both MO1 and MO2 morphants compared with CoMO fish. The microphonic waveforms were measured in root mean square and averaged 200 times. (E) Comparison of microphonic threshold among CoMO, MO1, and MO2 morphants, showing significant increases in microphonic threshold for MO1 and MO2 morphants. In D?E, data are presented as means + SEM; NCoMO = 10, NMO1 = 8, NMO2 = 9, ANOVA, and post hoc Tukey tests, ****P < 0.001.
|

