|
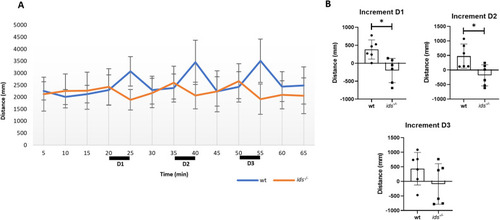
ids mutant larvae exhibit significantly altered anxiety-induced response. A 15 dpf ids mutant and wild-type larvae were challenged with the LDT test to elicit an anxiety-like response. The bar graph on the left reports the mean distance run by each group of larvae every five minutes (representative trial). Black boxes are put in correspondence to the five minutes of complete darkness (D1: first dark phase, 20–25 min; D2: second dark phase, 35–40 min; D3: third dark phase, 50–55 min). Data are expressed as the mean ± SD (n = 6 biological replicates). B The bar graphs depict the evaluation of the “increments” for each dark phase. During D1 and D2 ids mutant larvae display a negative value of the increment, whereas controls increment their locomotion, as expected. In D3, no differences were observed between genotypes (n = 6 independent experiments). Data are expressed as the mean ± SD (*p < 0.05; t-test).
|