|
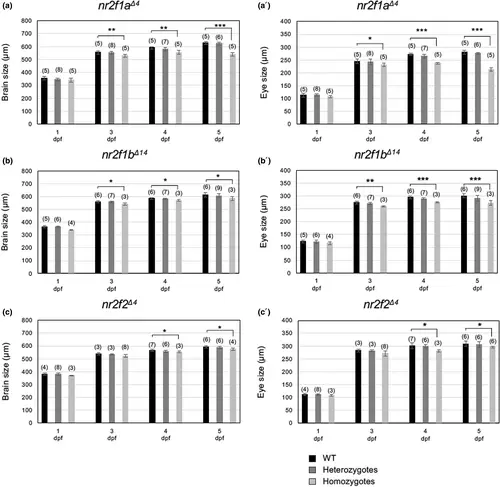
Quantification of the sizes of the brain and eyes. The sizes of the brain (a?c) and eye (a??c?) of the embryos obtained from crosses between nr2f1 heterozygous fish were quantified at 1?5 dpf. Quantification was conducted using the line tool of ImageJ. To determine brain size, the distance from the anterior end of the telencephalon to the posterior margin of the otic vesicle was measured in the lateral view at 24 hpf and in the dorsal view at later stages. To determine eye size, the diameters of the optic vesicles along the anteroposterior axes were quantified in the lateral view. Differences were analyzed by the Student's t-test. Asterisks indicate significant differences (*p > .05; **p > .01; ***p > .001).
|

