|
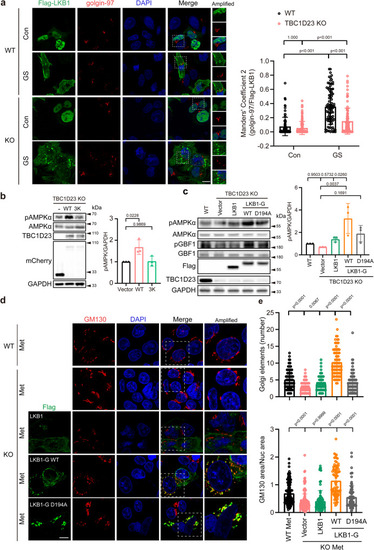
TBC1D23 and LKB1 cooperate to promote Golgi-AMPK activation. a WT and TBC1D23 KO HepG2 cells were transiently transfected with Flag-LKB1 for 24 h and glucose starved for 2 h. Cells were stained with antibodies against Flag and golgin-97. Scale bar, 10 μm. Mander’s coefficient 2 (golgin-97 overlapping with Flag-LKB1) were graphed as mean ± SD. Each dot represents Mander’s coefficient from one cell. WT Con: n = 81; WT GS: n = 92; KO Con: n = 116; KO GS: n = 98. b TBC1D23 KO HEK293T cells were transiently transfected with mCherry-vector, mCherry-TBC1D23 WT or mCherry-TBC1D23 3 K mutant for 24 h. Cells were treated with a medium deprived of glucose for 2 h before harvest. Whole-cell lysates were analyzed by immunoblotting. The graph shows the levels of pAMPK quantified by densitometry using Image J software and normalized to GAPDH. c TBC1D23 KO HEK293T cells were transiently transfected with indicated constructs for 24 h, WT HEK293T cells as the control. Cells were treated with medium deprived of glucose for 2 h before harvest and immunoblotted with indicated antibodies. The graph shows the levels of pAMPK quantified by densitometry using Image J software and normalized to GAPDH. d Confocal micrographs of WT or TBC1D23 KO HepG2 cells expressing the indicated constructs were treated with metformin (Met, 10 mM, 4 h) and co-stained with antibodies against Flag and GM130. Scale bar, 10 μm. e Bar graph represents the quantitation of the Golgi disassembly. Each dot in the figure represents the number of Golgi elements from one cell (upper pannel); the ratio between the total area occupied by GM130 and the nucleus (DAPI) was also used to indicate Golgi disassembly (lower pannel). WT: n = 142; KO: n = 165; KO + LKB1: n = 88; KO + LKB1-G WT: n = 79; KO + LKB1-G D194A: n = 85. n indicates pooling cells from one replicate (a, d). Similar results were obtained in three independent experiments (a–d). Results are presented as mean ± SD (a–d), and p values were determined by Scheirer-Ray-Hare Test (a) or by one-way ANOVA, followed by Dunnett’s test (b, c), or by Kruskal–Wallis test (e). Source data are provided as a Source data file.
|