|
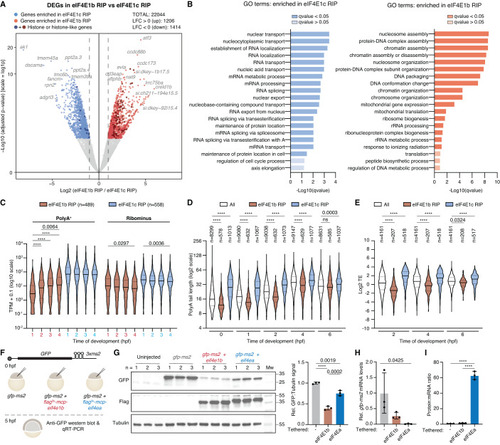
eIF4E1b binds to translationally repressed mRNAs involved in chromatin regulation. (A) Differential expression gene (DEG) analysis of mRNAs immunoprecipitated with eIF4E1b or eIF4E1c at 1.25 h post fertilization. mRNAs significantly enriched in eIF4E1b (n = 3 biological replicates) or eIF4E1c (n = 2 biological replicates) immunoprecipitations are shown in red and blue, respectively (P value < 0.005). Genes encoding proteins with histone and histone-like domains are highlighted in a darker color. Significance was determined using Benjamini–Hochberg-corrected Wald test (DeSeq2). (B) Gene ontology (GO) analysis of mRNAs that are specifically bound to eIF4E1c (left, in blue) or to eIF4E1b (right, in red). (C) Expression levels (in transcript per million, TPM) of mRNAs enriched in eIF4E1b and eIF4E1c RIPs during zebrafish embryogenesis according to published RNA-seq datasets obtained with polyA-selection (PolyA+) and rRNA depletion (Ribominus) protocols (Cabrera-Quio et al, 2021). (D) PolyA tail length of mRNAs enriched in RIPs with eIF4E1b or eIF4E1c during zebrafish embryonic development based on published TAIL-seq data (Chang et al, 2018) (ns non-significant). (E) Translational efficiency (TE) of mRNAs enriched in eIF4E1b and eIF4E1c RIPs during zebrafish embryogenesis based on published TE data (Subtelny et al, 2014). (F) Schematic of the eIF4E tethering assay: A GFP reporter mRNA containing MS2 loops at the 3′ UTR (top) and an mRNA containing eIF4Ea or eIF4E1b fused to an N-terminal 3xflag-MCP (MS2 Coat Protein) tag were injected into 1-cell embryos. After 5 h, GFP protein and mRNA levels were assessed by western blot and RT-qPCR, respectively. (G) Western blots showing GFP (top), Flag (middle) and α-Tubulin (loading control; bottom) protein levels in 5 hpf embryos after injection with the mRNAs described in (F). Uninjected embryos are also shown. Quantification of GFP signal normalized to α-Tubulin is shown on the right (n = 3 experimental replicates). (H) Levels (assessed by RT-qPCR) of GFP reporter mRNA tethered to either eIF4Ea or eIF4E1b compared to non-tethered GFP mRNA in 5 hpf embryos (n = 3 experimental replicates). (I) Protein to mRNA ratio of the GFP reporter mRNA alone or tethered to eIF4Ea or eIF4E1b, as estimated from western blot (G) and RT-qPCR (H) (n = 3 experimental replicates). Data information: (C–E) lines indicate median and first and third quartiles; in (G–I), columns indicate mean and error bars show the SD. (C–E) Significance was assessed with Kruskal–Wallis followed by Dunn’s test. (G–I) Significance was determined using ordinary one-way ANOVA followed by a Tukey’s multiple comparisons test. (C) Significance was calculated for eIF4E1b RIP or eIF4E1c RIP in PolyA+ or Ribominus data (if not stated, P value > 0.005). (D, E) statistics are shown only for comparisons within the same developmental stage. Hpf hours post fertilization. ****P value < 0.0001. Source data are available online for this figure.
|

