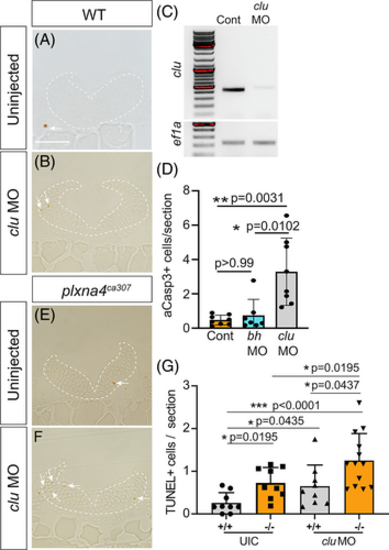
Clu acts independently of Plxna4 to promote hindbrain cell survival. (A, B, E, F) Hindbrain sections of 24 hpf WT (A), clu ATG-morpholino-injected WT (B), plxna4 mutant (E), and clu ATG-morpholino-injected mutant (F) embryos. Arrows point to TUNEL+ cells. (C) RT-PCR of cDNA generated from mRNA isolated from 24 hpf control embryos and embryos injected at the 1-cell stage with an e3i3 antisense morpholino targeting the exon 3-intron 3 splice junction in the clu pre-mRNA. Endogenous mRNA is downregulated and is slightly larger in size in the e3i3 morphants than control embryos. PCR band for ef1a was similar between control embryos and e3i3 morphants. (D) Graph shows numbers of activated caspase-3 immunolabeled cells counted in sections (n = 5-11 sections/embryo) of the 24 hpf hindbrain of embryos injected at the 1-cell stage with 2 to 3 ng of either the clu e3i3 MO or an e2i2 MO targeting the bhlhe40 gene; control (n = 8), bhlhe40 e2i2 MO (n = 7) and clu e3i3 MO (n = 8); N = 2 independent replicates. Error bars are SD and dots represent individual embryos. One-way ANOVA, Kruskal?Wallis non-parametric post-hoc test. (E) Blinded quantitation of TUNEL+ cells in each condition. MO, morpholino oligonucleotide; UIC, uninjected control. All N = 3, n = 9 except ?/? clu MO N = 3, n = 13. One Way ANOVA, Kruskal?Wallis test. Scale bar in A is 75 ?m.
|

