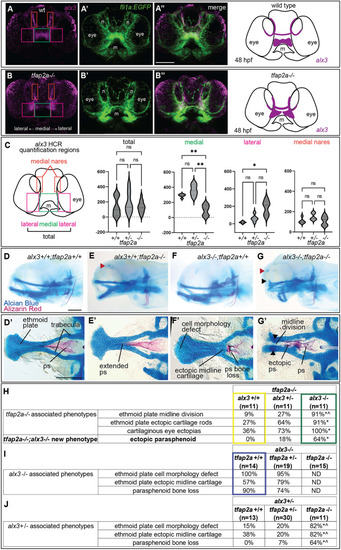
Gene expression and epistasis studies indicate zebrafish alx3 is genetically downstream of tfap2a. (A-B″) Frontal views of zebrafish embryos at 48 h post-fertilization (hpf). alx3 in situ HCR (magenta, A,B), fli1a:EGFP-labelled cranial neural crest cells (green, A′,B′) or the merge (A″,B″) in a control (A-A″) and a tfap2a−/− (B-B″) sibling. Schematics summarizing expression patterns observed for alx3 are shown on the far right, n=5 per genotype. Boxes in A and B show regions used for quantification in C. (C) Quantification of HCR signal in distinct domains of the larval head, as indicated by boxed regions in the schematic. (D-G) Whole-mount, lateral views of Alizarin Red/Alcian Blue stained skeletal preparations of 6-day-old zebrafish heads, with indicated genotypes. The anterior is towards the left. (D′-G′) Neurocrania were dissected and flat mounted. Red arrowheads indicate ectopic cartilage near the eye socket. Black arrowheads mark dorsally projecting ectopic ethmoid plate cartilage. (H-J) Tables summarizing penetrance, sample sizes and statistics of the epistasis experiments as follows: (H) the removal of wild-type alx3 copies from tfap2a homozygous mutants; (I) removal of wild-type tfap2a copies from alx3 homozygous mutants; (J) removal of wild-type tfap2a copies from alx3 heterozygotes. Boxed values correspond to the genotypes shown in E, F′ and G. Yellow, tfap2a mutant phenotypes and their penetrance (corresponding to E, E′, G′); green, removal of both alx3 copies in tfap2a-mutant backgrounds (corresponding to G, G′); purple, alx3 mutants (F′). Asterisks indicate significant difference (P<0.05) compared with the far-left column and carets indicate significant difference (P<0.05) compared with middle column (Fisher's exact test). Scale bars: 100 µm. m, mouth; n, nares; ND, not determined; ps, parasphenoid.
|
