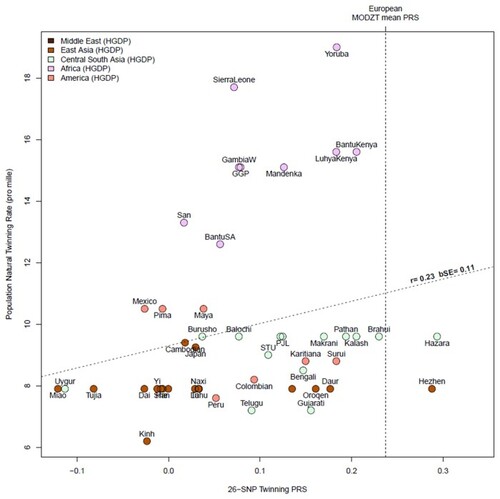
The correlation between population twinning rates from 53 populations and predicted dizygotic twin (DZT) polygenic risk score (PRS) for each population based on European effect sizes of top single nucleotide polymorphisms (SNPs) from Table 2. The twinning rate data are derived from Smits & Monden Demographic and Health Surveys (Smits and Monden, 2011). The HGDP group twinning rates are taken as those of the country from which they derive (e.g. Mandinka from Senegal); we have added twinning rate data for UK and Japan from Imaizumi (Imaizumi, 2003), other European twinning rates from Heino et al. (2016) and rates for Australia from the Australian Bureau of Statistics, 2010. The SNPs and their effect sizes are the 26 (unique) top associated SNPs from our genome wide association meta-analysis (GWAMA) listed in Table 2, excluding (for technical reasons) rs17293443, rs16050687, and rs17293443. Allele frequencies were obtained from the Human Genome Diversity Project and the 1000 Genomes Projects. We calculated the Pearson correlation and a bootstrap standard error (R boot package, 1000 replicates) using country-level rate and mean PRS for 53 populations. The vertical dotted line is the mean PRS for all mothers of DZ twins in the current study. The oblique line shows the regression line of observed twinning rate on the predicted DZT PRS for each population.
|