|
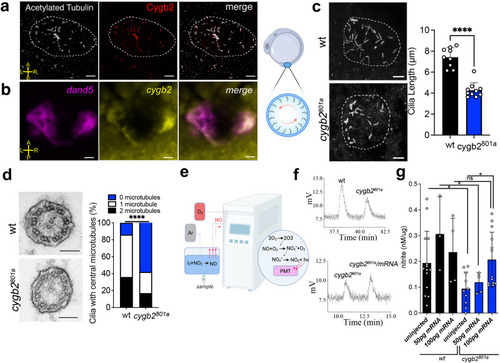
Cygb2 is expressed in cilia and through NO production regulates cilia structure. a Kupffer’s vesicle (KV) at 8–10 somites stained with anti-acetylated tubulin (white) to visualize cilia and anti-Cygb2 (red) on whole mount embryos. The KV is outlined with a white dashed line. Scale bar = 10 μm. b Whole mount fluorescent in situ hybridization labeling dand5 (magenta) and cygb2 (yellow) transcripts using RNAscope. Image orientation: A- anterior, P- posterior, L- left, R- right. Scale bar = 10 μm. a, b show representative images of three experiments. On the right, rendering of a zebrafish embryo at 10 somites denoting the location of the KV. Panel generated with BioRender.com. c Immunostaining of KV cilia in wt and cygb2801a with anti-acetylated tubulin antibody. On the right, average cilia length. Means are ± SD (n = 9–10 embryos). Student’s t test, two-tailed, ****P < 0.0001. Scale bar = 10 μm. d Transmission electron microscopy of KV cilia comparing wt and cygb2801a. Scale bar = 100 nm. On the right, quantification of the number of central microtubules represented as the percentage of total number of cilia analyzed (n = 12–13 embryos). Chi-square test, ****P < 0.0001. e Schematic of the NO Analyzer (NOA). Panel generated with BioRender.com. f Chemiluminescence detection of NO production by triiodide assay using pools of 50 embryo (10 somites) lysates as samples comparing wt to cygb2801a(above) and uninjected cygb2801a to cygb2 mRNA injected cygb2801a (below). g Quantification of nitrite levels normalized to protein amount. Samples represent pools of embryos (n = 3–14, each n is the lysate of 50 embryos) uninjected or injected with cygb2 mRNA (50 or 100 pg). Black bars represent wt embryos and blue bars represent cygb2801a embryos. Means are ± SD. Student’s t test, two-tailed, *P < 0.05. Source data are provided as source data file.
|

