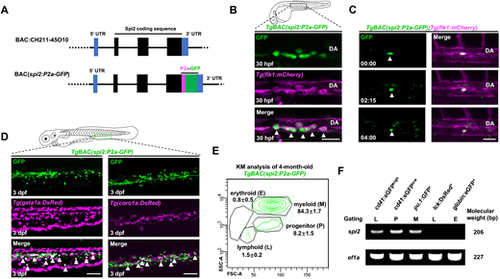
Generation and characterization of TgBAC(spi2:P2a-GFP) zebrafish. (A) Strategy for generating spi2 BAC construct. (B) Images of spi2:GFP expression in the aorta-gonad-mesonephros (AGM) in the TgBAC(spi2:P2a-GFP);Tg(flk1:mCherry) fish at 30 hpf. DA, dorsal aorta. Arrowheads show GFP+mCherry+ cells. (C) Time-lapse imaging frames of TgBAC(spi2:P2a-GFP);Tg(flk1:mCherry) fish indicate an endothelial-to-hematopoietic transition (EHT) event of an spi2-GFP+ cell (white arrowhead) from 30 hpf. (D) Images of the caudal hematopoietic tissue (CHT) in the TgBAC(spi2:P2a-GFP);Tg(gata1a:DsRed) (left) and TgBAC(spi2:P2a-GFP);Tg(coro1a:DsRed) (right) fish at 3 dpf. spi2-GFP+ cells are co-localized with gata1a-DsRed+ (left, white arrowhead) and coro1a-DsRed+ (right, white arrowhead) cells. (E) FACS analysis of the kidney marrow (KM) of adult TgBAC(spi2:P2a-GFP) fish. spi2-GFP+ cells are predominantly found in progenitor- and myeloid-gated populations. (F) qPCR analysis of spi2 expression in FACS-gated populations from WT adult KM. spi2 is enriched in HSPCs (cd41-eGFPlow), myeloid cells (pu.1-GFP+), and thrombocytes (cd41-eGFPhigh). ef1a is used as an internal control. Scale bars: 30 ?m (B); 40 ?m (C); 60 ?m (D).
|
