
Fig. 1
- ID
- ZDB-FIG-231208-16
- Publication
- Dogra et al., 2023 - kcna1a mutant zebrafish model episodic ataxia type 1 (EA1) with epilepsy and respond to first-line therapy carbamazepine
- Other Figures
- All Figure Page
- Back to All Figure Page
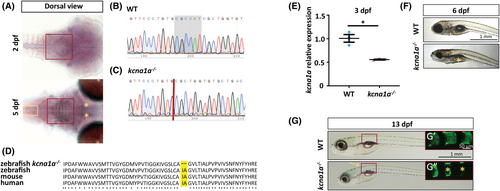
Expression analysis of kcna1a and generation of kcna1a−/− zebrafish model using CRISPR/Cas9 technique. (A) In situ hybridization for kcna1a expression at 2 dpf and 5 dpf. Red boxes indicate RNA probe signal in M cells in hindbrain at 2 dpf and 5 dpf. Yellow asterisks indicate RNA probe signal in nMLF in midbrain at 5 dpf. Yellow box indicates RNA probe signal in the neurons present in the spinal cord at 5 dpf. (B, C) Nucleotide sequences of kcna1a in zebrafish WT and kcna1a−/−. Gray highlighted region indicates the six nucleotides deleted due to mutation in kcna1a−/−. (D) Amino acid sequence of Kcna1a in zebrafish kcna1a−/− and WT, and orthologues in mouse (KCNA1) and human (KCNA1). Yellow highlighted region indicates two amino acid deletions due to mutation in kcna1a−/−. (E) qPCR analysis for relative kcna1a mRNA expression in 3 dpf kcna1a−/− larvae compared to WT. WT and kcna1a−/−, n = 3 × 10 larvae assessed as three biological and two technical replicates each. kcna1a is downregulated in kcna1a−/− indicating active mRNA degradation. (F) WT and kcna1a−/− larvae at 6 dpf. Yellow asterisk indicates absence of swim bladder in kcna1a−/− larvae. (G, G′, G″) WT and kcna1a−/− larvae at 13 dpf. Yellow arrow points to spinal curvature progression in kcna1a−/− larvae. Red boxes outline the trunk regions with alizarin red stained vertebral segments (G′, G″). Yellow asterisks indicate missing or deformed vertebral segments in kcna1a−/− larvae. Scale bars = 1 mm, 50 μm. Data are mean ± SEM, *p ≤ .05- Unpaired t test. dpf, days post fertilization; M cells, Mauthner cells; nMLF, nucleus of the medial longitudinal fasciculus; WT, wild-type. |