Fig. 1
- ID
- ZDB-FIG-231130-2
- Publication
- Zhao et al., 2022 - Hemogenic and aortic endothelium arise from a common hemogenic angioblast precursor and are specified by the Etv2 dosage
- Other Figures
- All Figure Page
- Back to All Figure Page
|
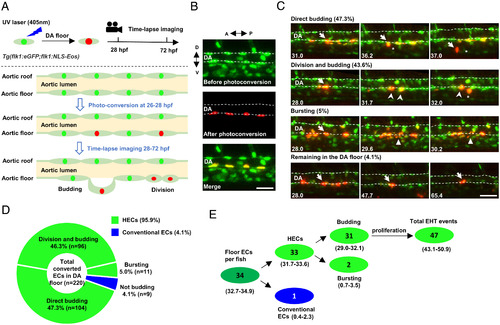
Time-lapse imaging indicates that the endothelium in the DA floor are HECs. (A) Schematic diagram showing the strategy of photoconversion of the floor endothelium in the DA and time-lapse imaging in Tg(flk1:eGFP;flk1:NLS-Eos) transgenic zebrafish. The green, red, and light green dots indicate the nuclei before photoconversion, the nuclei after photoconversion, and eGFP in the cytoplasm, respectively. (B) Representative images of the photoconverted floor endothelium at 26 hpf. (C) Images representing four types of behaviors of the DA floor endothelium during EHT (28 to 72 hpf) captured by time-lapse imaging. The dashed lines indicate the roof and floor boundaries of the DA, the white arrow indicates successfully converted cells, the white arrowhead indicates the descendants of labeled cells, the white triangle indicates bursting cells, and the asterisk indicates budding cells. Captured time points are labeled at the bottom left. (D) Summary of the behaviors of floor endothelium during 28 to 72 hpf captured by time-lapse imaging. (E) Estimated number of HECs and cECs in the DA floor per fish and their behaviors with 95% (CI). Data were analyzed with 220 cells by five independent experiments with 40 embryos. A, anterior; D, dorsal; P, posterior; V, ventral. (Scale bars, 30 µm.). |

