FIGURE

Fig. 9

ID
ZDB-FIG-231121-39
Publication
Santhanam et al., 2023 - Molecular basis of retinal remodeling in a zebrafish model of retinitis pigmentosa
Other Figures
All Figure Page
Back to All Figure Page
Fig. 9

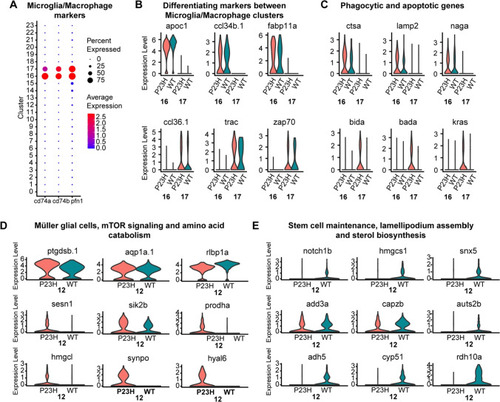
Comparative transcriptomic analysis of microglial/macrophage clusters and Müller glial cells in the zebrafish retina. AC Microglia/Macrophages; D, E Müller glial cells. A Dot plot showing the specific enrichment of canonical markers cd74a and cd74b, as well as the non-canonical marker pfn1 in the microglia/macrophage cell clusters. B Violin plots showing the expression of cluster-specific markers between the two microglial/macrophage clusters (16 and 17). C Violin plot showing the expression of increased phagocytic and apoptotic markers in P23H microglia/macrophages. D Violin plots showing the specific enrichment of canonical Müller glial cell markers as well as changes in DEGs involved in mTOR signaling and amino acid catabolism. E Violin plots showing the decreased levels of DEGs involved in stem cell maintenance, lamellipodium assembly and sterol biosynthesis in P23H Müller glia

Expression Data

Expression Detail
Antibody Labeling
Phenotype Data

Phenotype Detail
Acknowledgments
This image is the copyrighted work of the attributed author or publisher, and ZFIN has permission only to display this image to its users. Additional permissions should be obtained from the applicable author or publisher of the image. Full text @ Cell. Mol. Life Sci.