|
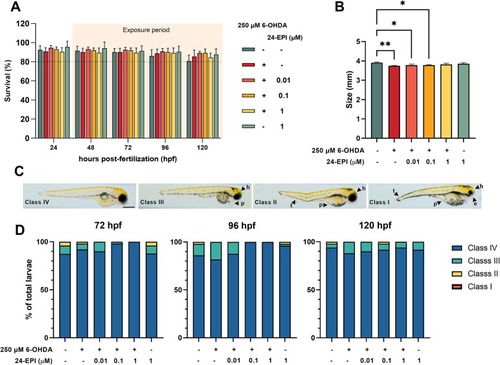
Fig. 2. Morphological assessment of zebrafish larvae during the experimental period. (A) Results for cumulative mortality throughout the exposure period. Data is expressed as mean ± SD from five independent replicates. No statistical differences were observed over time. (B) larvae body size. Data is expressed as mean ± SD from five independent replicates (10 larvae assayed for each treatment, n = 1). (C) Different classes attributed according to the morphological alterations induced by the treatment. The scale bar represents 500 μm. (D) Percentage of larvae in each morphological class at 72, 96 and 120 hpf for the different treatments. Data are presented as means with n = 5 (10 larvae assessed per replicate).
|