FIGURE

Fig. 6

ID
ZDB-FIG-230915-33
Publication
Vaparanta et al., 2023 - STAT5b is a key effector of NRG-1/ERBB4-mediated myocardial growth
Other Figures
All Figure Page
Back to All Figure Page
Fig. 6

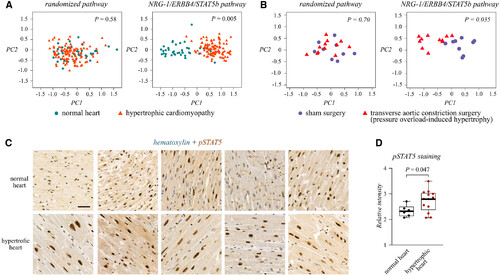
Figure 6. NRG-1/ERBB4/STAT5b signaling pathway is perturbed in pathological cardiac hypertrophy

  • A. Principal component and cluster analysis of transcripts of the NRG-1/ERBB4/STAT5b pathway (including the genes: NRG1, ERBB4, STAT5B, IGF1, MYC and DNM2) with clinical samples representing normal myocardium or hypertrophic cardiomyopathy. The dataset GSE36961 was acquired from the Gene Expression Omnibus database (Data ref: Hebl et al2012). One symbol in the plots corresponds to one subject (normal: n = 39, hypertophic cardiomyopathy n = 106; biological replicates). Statistical significance of clusterization was calculated by estimating a probability distribution for the relative distance within a cluster and between clusters and by drawing the cumulative probability from the resulting empirical cumulative probability function.
  • B. Principal component and cluster analysis of transcripts of the NRG-1/ERBB4/STAT5b pathway with samples representing myocardia of mice subjected to sham or transverse aortic constriction surgery. The dataset GSE5500 was acquired from the Gene Expression Omnibus database (Data ref: Bisping et al2006). One symbol in the scatterplots corresponds to one mouse (sham: n = 9, transverse aortic constriction: n = 12; biological replicates).
  • C, D. Immunohistochemical analysis (C) and quantification (D) of STAT5 activation in sections representing normal myocardia or pathological cardiac hypertrophy (n = 3, aortic stenosis; n = 2, idiopathic cardiomyopathy). Phospho-STAT5b staining intensity was quantified. One dot in the boxplot corresponds to one subject (normal: n = 6, hypertrophic n = 13; biological replicates). In the boxplot the central band represents the median, the box the interquartile range and whiskers the whole range of values. Unpaired two-tailed T-test was used for statistics. Scale bar 50 μm.

Source data are available online for this figure.

Expression Data

Expression Detail
Antibody Labeling
Phenotype Data

Phenotype Detail
Acknowledgments
This image is the copyrighted work of the attributed author or publisher, and ZFIN has permission only to display this image to its users. Additional permissions should be obtained from the applicable author or publisher of the image. Full text @ EMBO Rep.