
Fig. 6
- ID
- ZDB-FIG-230809-12
- Publication
- Prendergast et al., 2023 - CSF-contacting neurons respond to Streptococcus pneumoniae and promote host survival during central nervous system infection
- Other Figures
- All Figure Page
- Back to All Figure Page
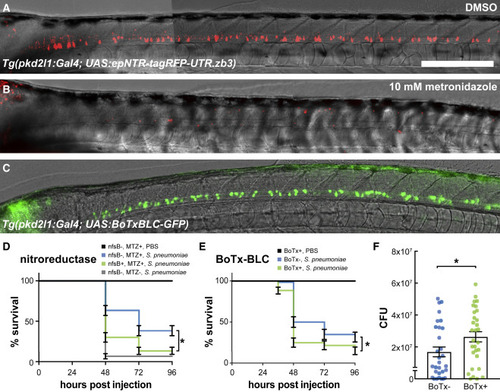
Figure 6. Secretory activity of CSF-cNs confers a survival benefit during pneumococcal meningitis (A) Tg(pkd2l1:GAL4; UAS:epNTR-tagRFPT-UTR.zb3) larva at 3 dpf following 24 h of incubation in 0.1% DMSO. Scale bars, 500 ?m. Figure S3 addresses how complete NTR expression is in the full complement of CSF-cNs. (B) Sibling larva incubated for the same time period in 10 mM metronidazole (MTZ). All tagRFP+ CSF-cNs are lost. (C) Expression of BoTxBLC-GFP in the Tg(pkd2l1:GAL4; UAS:BoTxBLC-GFP) larva at 3 dpf. (D) Survival curves of Tg(pkd2l1:GAL4; UAS:epNTR-tagRFPT-UTR.zb3)(nfsB) larvae and their siblings when exposed to metronidazole or DMSO from 1 to 2 dpf, washed with fish facility water, and subsequently infected with 4,000 CFU S. pneumoniae. Metronidazole alone slightly protects larvae against infection by S. pneumoniae (compare blue and gray lines, log-rank test, p < 0.0001). However, metronidazole-mediated ablation of CSF-cNs confers a large survival deficit (compare blue and green lines, log-rank test, p = 0.0002). The survival data represent the mean � SEM of three individual experiments with n = 20 larvae per group (total n = 60 per group). (E) Survival curves of Tg(pkd2l1:GAL4; UAS:BoTxBLC-GFP) ("BoTx") larvae (green line) and non-transgenic sibling controls (blue line) injected with ?300 CFU S. pneumoniae D39 wild-type strain into the hindbrain ventricle at 2 dpf reveal that BoTx-expressing larvae exhibit higher mortality rates (log-rank test, p = 0.0065). The survival data represent the mean � SEM of three individual experiments with n = 20 larvae per group (total n = 60 per group). Figure S7 shows that knocking out individual secreted factors identified by the transcriptome does not impair larval survival in the meningitis model. (F) Tg(pkd2l1:GAL4; UAS:BoTxBLC-GFP) (referred to as ?BoTx?) larvae (green line) exhibit higher bacterial loads at 24 h post injection as compared with non-transgenic sibling controls (unpaired t test, p = 0.0368). Each dot represents a single larva. Error bars = mean � SEM of three individual experiments with n = 10 larvae per group (total n = 30 per group). See also Figures S3 and S7 and Table S1. |