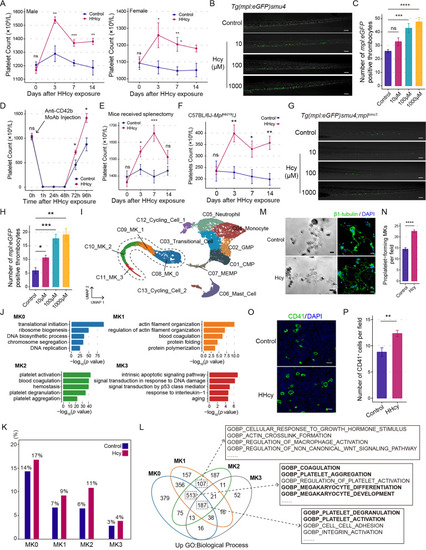
Hcy facilitates MKs differentiation and platelet production. A Peripheral PLT in C57BL/6J mice. Significance according to two-tailed unpaired t test (n = 8). B Representative images for staining and C quantification of mpl:eGFP+ cells (green) in zebrafish Tg(mpl:eGFP)smu4 larvae caudal hematopoietic tissue (CHT) region. Scale bars, 50 μm. Significance according to one-way ANOVA with Tukey multiple comparisons test (n = 10). D PLT recovery after platelet depletion by monoclonal rat anti-mouse CD42b antibody (Anti-CD42b MoAb). Significance according to two-tailed unpaired t test (n ≥ 5). E PLT in splenectomized mice. Significance according to two-tailed unpaired t test (n = 8). F PLT in C57BL/6J-Mplhlb219/J mice. Significance according to two-tailed unpaired t test (n ≥ 5). G Representative images for staining and H quantification of mpl:eGFP+ cells (green) at mpl-mutational zebrafish Tg(mpl:eGFP)smu4;mplsmu3 larvae CHT region. Scale bars, 50 μm. Significance according to Welch ANOVA test with Dunnett T3 multiple comparisons test (n = 10). I 13 cell clusters were displayed by UMAP. Colors indicate cell types. CMP, common myeloid progenitor; GMP, granulocyte-monocyte progenitor; MEMP, megakaryocyte-erythroid-mast cell progenitor; MK, megakaryocyte. J Bar diagram showing the representative GO biological process terms of MKs subpopulations. K Bar diagram showing the percentage of each MKs subpopulation number to all cells. L Venn diagram visualizing the up-regulated biological processes of each MKs subpopulation in Hcy group compared with control group. M Representative images of PPF detected by phase contrast imaging (left) and confocal microscopy (right). β1-tubulin (green) and DAPI (blue) were stained; Scale bars, 20 μm. N Histogram showing the number of PPF-MKs. Significance according to two-tailed unpaired t test (n = 6). O Representative images and P quantification of CD41+ MKs (green) in mice femurs bone marrow by immunofluorescence staining. Scale bars, 50 μm. Significance according to two-tailed unpaired t test (n = 8). *p < 0.05, **p < 0.01, ***p < 0.001, ****p < 0.0001, ns not significant
|

