Figure 3
- ID
- ZDB-FIG-230724-47
- Publication
- Herget et al., 2023 - Altered glucocorticoid reactivity and behavioral phenotype in rx3-/- larval zebrafish
- Other Figures
- All Figure Page
- Back to All Figure Page
|
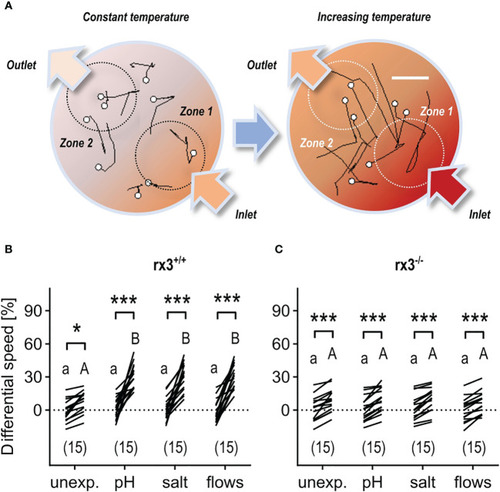
Response to rising temperature in rx3+/+ and rx3-/- zebrafish larvae under basal and stressed conditions. (A) Representative 1 s swim paths from larvae showing increased speed and turns near the inlet (bottom right arrow) as the temperature inside the swimming chamber increases faster in zone 1. White dots indicate start positions. Scale bar, 2.5 mm. Adapted from 43. (B, C) Differential speed, i.e., the difference between swim velocity (mm per 40 ms) in zones 1 and 2 (in %), across groups of unexposed (control) and pre-exposed (to either ‘pH’, ‘salt’ or ‘flows’) rx3+/+(B) and rx3-/-(C) larvae before and after the onset of temperature rise (see also Methods). Sample size in parentheses. (B, C) Letters and asterisks indicate results of Bonferroni’s tests (P<0.001) after two-way repeated measures ANOVAs; (B) time factor: F(1,56)=215.2, P<0.0001, treatment factor: F(3,56)=7.7, P=0.0002, time × treatment factor: F(3,56)=9.2, P<0.000; (C) time factor: F(1,56)=163.0, P<0.0001, treatment factor: F(3,56)=0.2, P=0.91, time × treatment factor: F(3,56)=0.3, P=0.83. |

