|
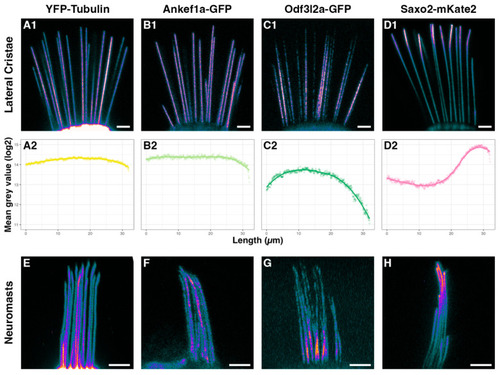
Distributions of tubulin, Ankef1a, Odf3l2a, and Saxo2 in the hair cell kinocilium at 5–6 dpf. (A1–D1) Pixel intensity-encoded images of tagged alpha-tubulin, Ankef1a, Odf3l2a, and Saxo2 proteins in the kinocilia of lateral cristae hair cells. Brighter colours indicate higher fluorescence intensity. (A2–D2) Scatter plots of averaged mean grey values (log2) for fluorescence intensity from kinocilia in the lateral cristae of YFP-TUBA (n = 35 kinocilia from 8 individuals), Ankef1a-GFP (n = 23 from 8 individuals), Odf3l2a-GFP (n = 30 from 11 individuals), and Saxo2-mKate2 (n = 17 from 6 individuals). Position 0 µm is from the proximal region near the base of kinocilia and position 32 µm is the distal-most tip. (E–H) Pixel intensity-encoded images of neuromast kinocilia from YFP-TUBA, Ankef1a-GFP, Odf3l2a-GFP, and Saxo2-mKate2 expressing zebrafish larvae. Scale bars are 5 µm in panels (A1–D1,E–H).
|