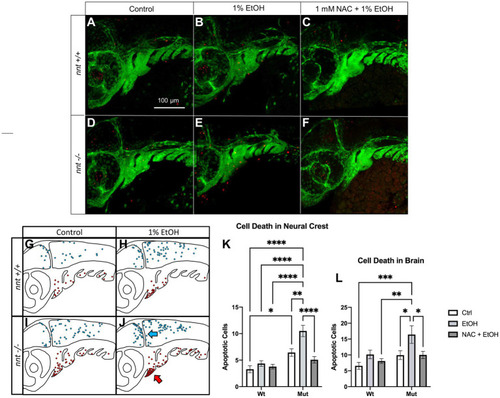
Aberrant ethanol-induced apoptosis in nnt mutants is rescued by antioxidant treatment. (A–F) 36 hpf nnt;fli1a:eGFP (green) embryos stained with TUNEL (red) (n = 14 per group). Lateral views, anterior to the left, dorsal up. (A) Unexposed wildtypes had significantly lower apoptosis in the pharyngeal arches compared to (D) unexposed mutants (p = 0.0230). (B) 1% ethanol-dosed wildtypes had significantly less apoptosis in the arches and brain compared to (E) ethanol-treated mutants (p = <0.0001 and p = 0.0003). (C) 1 mM NAC + 1% EtOH dosed wildtypes were not significantly different from (F) NAC + EtOH-treated mutants (p = 0.7775), but NAC + EtOH mutants had significantly lower apoptosis in the arches and brain compared to ethanol-dosed mutants (p = <0001 and p = 0.0491, respectively). (G–J) Schematic of the spatial distribution of apoptosis in the brains (blue arrow) and pharyngeal arches (red arrow) of untreated and ethanol-treated mutants and wildtypes (n = 5 per group). (G) The wildtype control had fewer apoptotic cells that were more widely distributed across the brain and arches compared to the (H,I) unexposed mutants and ethanol-treated wildtypes that had higher levels of apoptosis in both regions. (J) Ethanol-treated mutants had more apoptosis than all other groups and had cell death localized to the ventral portion of the arches and clustered around the midbrain-hindbrain boundary. (K) Graph depicting apoptotic cells in the neural crest across all groups (Two-way ANOVA with multiple comparisons, black bars depict mean ± SEM, n = 14 per group, *p < 0.05, **p < 0.01, ****p < 0.0001). (L) Graph depicting apoptotic cells in the brain across all groups (Two-way ANOVA with multiple comparisons, black bars depict mean ± SEM, n = 14 per group, *p < 0.05, **p < 0.01, ***p < 0.001). Ctrl: control, EtOH: ethanol, NAC: N-acetyl Cysteine, Mut: mutant, Wt: wildtype.
|
