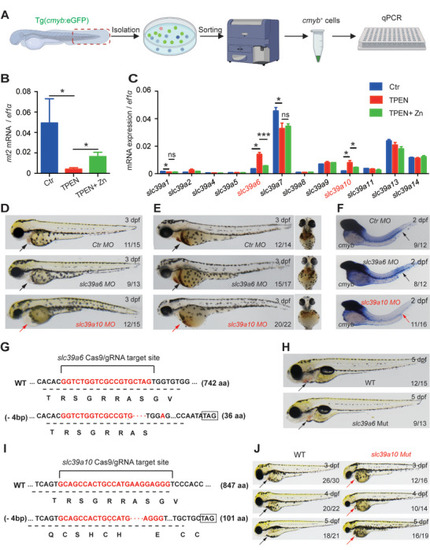
Functional screening in zebrafish reveals Sslc39a10 as a potentially important zinc transporter in early hematopoiesis. A) Schematic diagram depicting the strategy for performing functional screening in zebrafish. B,C) Relative levels of the indicated mt2 and slc39a family genes were measured in cmyb+ cells treated at 60–72 hpf with 100 µm TPEN or/and 100 µm ZnSO4 (n = 3 per group). D) Representative images of embryos at 3dpf following injection of a control morpholino (MO), slc39a6 MO, or slc39a10 MO. The arrows indicate the heart region. Note the visibly smaller head and presence of cardiac edema in the slc39a10 morphant embryo. E) Representative images of o‐dianisidine‐stained embryos at 3dpf following injection of the control MO, slc39a6 MO, or slc39a10 MO. The arrows indicate the heart region. F) Whole‐mount in situ hybridization (WISH) of cmyb in 2dpf embryos after injection of the control MO, slc39a6 MO, or slc39a10 MO. Note the extremely low expression of cmyb in the caudal hematopoietic tissue (CHT) region (arrows) in the slc39a10 morphant. G) DNA and corresponding amino acid sequences of the wild‐type (WT) slc39a6 allele and the mutant allele after a 4‐nucleotide deletion (‐4 bp) using CRISPR/Cas9‐based editing, introducing a premature stop codon. H) Representative images of a WT embryo and slc39a6 mutant sibling at 5dpf. The arrows indicate the heart region. I) DNA and corresponding amino acid sequences of the WT slc39a10 allele and mutant allele after a 4‐nucleotide deletion (‐4 bp) using CRISPR/Cas9‐based editing, introducing a premature stop codon. J) Representative images of WT embryos and slc39a10 mutant siblings at the indicated stages. The arrows indicate the heart region. The data in (B) and (C) are presented as the mean ± SD. p values were determined using one‐way ANOVA with Tukey's post hoc test (for multi‐group comparisons). *p < 0.05, ***p < 0.001, and ns, not significant.
|

