
Figure 3
- ID
- ZDB-FIG-230518-68
- Publication
- Weichert-Leahey et al., 2023 - Genetic predisposition to neuroblastoma results from a regulatory polymorphism that promotes the adrenergic cell state
- Other Figures
- All Figure Page
- Back to All Figure Page
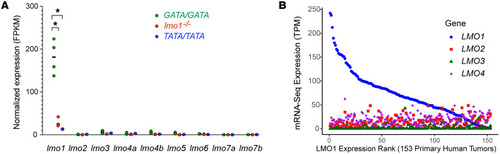
Expression of the lmo family genes in zebrafish and human neuroblastoma.
(A) RNA-Seq analysis was performed to measure the relative mRNA expression of lmo family genes in neuroblastomas arising in zebrafish with the indicated genotypes (GATA/GATA, n = 4; lmo1?/?, n = 3; and TATA/TATA, n = 2). mRNA expression levels for the indicated lmo family genes are represented by FPKM log-scale values. Expression under 1 FPKM is considered as nonexpressed. Statistical analysis was performed using the 2-tailed, unpaired t test. *P < 0.005. (B) Relative LMO1-4 mRNA expression levels measured by RNA-Seq in 153 primary human neuroblastoma samples (from TARGET), ranked from highest (left) to lowest levels of LMO1 expression (in FPKM). Expression correlation analysis demonstrated weak inverse correlation between LMO1 and the other 3 LMO family members (R ? ?0.3, P < 0.05). |