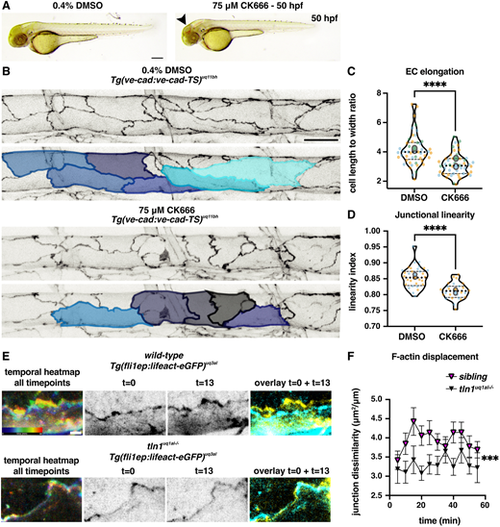
Actin polymerisation induces replicated endothelial cell remodelling phenotypes. (A) Bright-field images showing the overall body morphology at 50 hpf of embryos upon 5 h treatment with either 0.4% DMSO (control, left) or with 75 ?M CK666 (Arp2/3 inhibitor, right). CK666-treated embryos develop cranial haemorrhaging (arrowhead), reminiscent of tln1uq1al?/? mutants (Fig. 1A). Scale bar: 100 Ám. (B) Maximum projection of the dorsal aorta at 50 hpf, directly after treatment with either DMSO (control, top) or CK666 (bottom), showing impaired EC elongation. Duplicate images, one with false-coloured ECs to highlight EC shape. The colours present a spectrum: lighter colours indicate more elongated ECs. Scale bar: 25 Ám. (C) Quantification of EC elongation at 50 hpf, showing a significant reduction upon CK666 treatment, n=3 replicates: n=48 DMSO- and n=48 CK666-treated embryos (Mann?Whitney test, ****P<0.0001). (D) Quantification of cell-cell junction linearity at 50 hpf, showing a significant reduction upon CK666 treatment, n=3 replicates: n=48 DMSO- and n=48 CK666-treated embryos (unpaired t-test, ****P<0.0001). (E) Still images from time-lapse imaging (Movie 8). Movie records cortical F-actin rearrangements in wild-type (top) and tln1uq1al?/? mutant ECs (bottom) from 48 to 49 hpf. (Left) Temporal colour-coded projection of 13 timepoints imaged during the 1 h time-lapse. (Middle) Greyscale images of F-actin expression at the start (t=0) and the end of the movie (t=13). (Right) Overlay of t=0 (cyan) and t=13 (yellow) showing F-actin displacement in the wild type and very little movement in tln1uq1al?/? mutant. Scale bar: 5 ?m. (F) Quantification of F-actin displacements of cortical F-actin over the course of a 1-h time-lapse movie in siblings (magenta) and tln1uq1al?/? mutants (black) (Mann-Whitney test, ***P<0.001). Each data point represents the average displacement between two consecutive time-points, n=3 replicates: n=20 siblings and n=14 tln1uq1al?/? mutants. In C and D, replicate averages are depicted by large circles; smaller circles indicate individual data points of each replicate (colour matched).
|

