FIGURE

Figure 1.

ID
ZDB-FIG-230511-6
Publication
Wu et al., 2023 - Single-cell analysis reveals an Angpt4-initiated EPDC-EC-CM cellular coordination cascade during heart regeneration
Other Figures
All Figure Page
Back to All Figure Page
Figure 1.

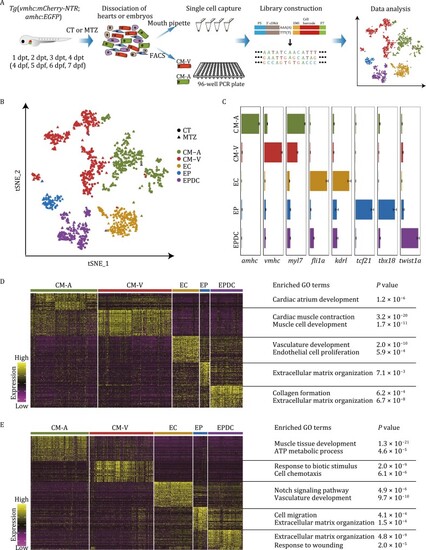
Single-cell RNA sequencing revealed molecular diversity of cells during zebrafish cardiac development and regeneration. (A) Schematic illustration of the workflow for the isolation of single cardiac cells followed by single-cell transcriptome analysis used in this study. CT, untreated control embryos; MTZ, MTZ-treated embryos; dpt, days post-treatment; dpf, days post-fertilization. (B) t-SNE analysis results of all captured cardiac populations colored by cluster identity. Single cardiac cells were collected at four stages after ventricular cardiomyocyte ablation induced by MTZ treatment and also from untreated control embryos (CT) of the corresponding developmental stages. CT cell number, 604; MTZ cell number, 977; total cell number, n = 1,581. CM-A, atrial cardiomyocyte; CM-V, ventricular cardiomyocyte; EC, endocardial cell; EP, epicardial cell; EPDC, epicardial-derived cell. (C) Bar plots showing the expression of marker genes in each cluster from (B). The expression levels are presented as mean ± s.e.m. (D and E) Heatmap showing the expression levels of DEGs for CT cells (D) and MTZ cells (E) of each cluster. Representative GO terms for each cluster were analyzed by Metascape and shown in the right column.

Expression Data

Expression Detail
Antibody Labeling
Phenotype Data

Phenotype Detail
Acknowledgments
This image is the copyrighted work of the attributed author or publisher, and ZFIN has permission only to display this image to its users. Additional permissions should be obtained from the applicable author or publisher of the image. Full text @ Protein Cell