
FIGURE 6
- ID
- ZDB-FIG-230504-20
- Publication
- Bise et al., 2023 - The regeneration-responsive element careg monitors activation of Müller glia after MNU-induced damage of photoreceptors in the zebrafish retina
- Other Figures
- All Figure Page
- Back to All Figure Page
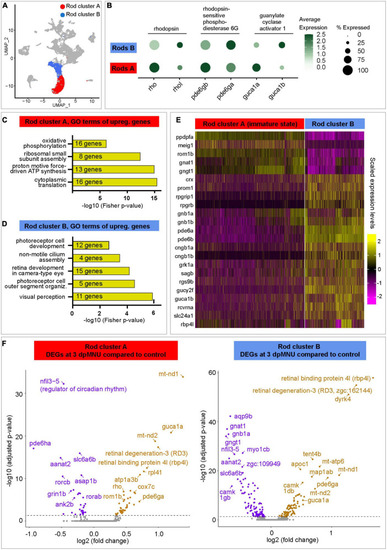
Transcriptome dynamics of immature and mature rods following MNU chemical injury. (A) UMAP plot of merged datasets showing the rod clusters in color and other cell clusters in gray. (B) Dot plot displaying differential expression levels of three pairs of paralogous genes of the rod identity in cluster A and B. (C,D) Selected Gene Ontology terms of upregulated genes in each rod cluster. Complete data are in Supplementary Table 4. (E) Heatmap of selected genes that display differential expression between both rod clusters. Complete data are in Supplementary Table 4. (F) Volcano plots of DEGs within each of rod clusters between 3 dpMNU compared to uninjured control. Complete data are in Supplementary Tables 5, 6. |