Fig. 2
- ID
- ZDB-FIG-230318-11
- Publication
- Miao et al., 2022 - The landscape of pioneer factor activity reveals the mechanisms of chromatin reprogramming and genome activation
- Other Figures
- All Figure Page
- Back to All Figure Page
|
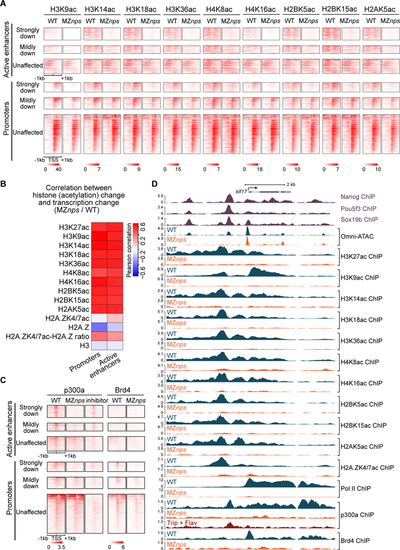
Nanog, Pou5f3, and Sox19b are required for histone acetylation across core histones and for recruitment of p300 and Brd4.
(A) Heatmaps showing histone acetylation levels across histones at N/P/S-bound active enhancers and promoters of differentially affected zygotic genes. Heatmaps are centered at TSSs (promoters) or Omni-ATAC peak summits (active enhancers) and ranked by Pol II binding intensity within 1kb of the TSS of the associated zygotic genes in wild-type (WT) embryos. (B) Heatmap showing the correlation between changes in transcription and changes in histone acetylation marks in MZnps/WT for N/P/S-bound active enhancers and promoters of zygotic genes. H2A.ZK4/7ac-H2A.Z ratio represents the ratio between H2A.ZK4/7ac and H2A.Z. (C) Heatmaps showing p300 and Brd4 levels at N/P/S-bound active enhancers and promoters of differentially affected zygotic genes. Heatmaps are centered and ranked as in (A). inhibitor: Pol II inhibitors (triptolide + flavopiridol). (D) Representative genome tracks of Pol II, p300, Brd4, and NPS binding, Omni-ATAC and histone acetylation across core histones in WT and MZnps embryos. See also Figure S2. |

