
FIGURE
Fig. 5
Fig. 5
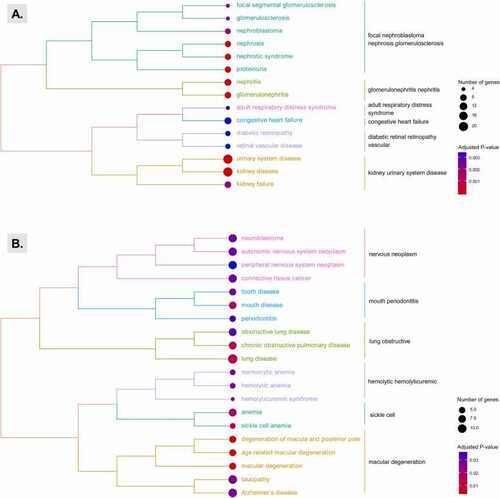
Tree plot of hierarchical clustering groups of disease ontology semantic and enrichment analysis terms for core DEGs. Each tree was created using the core DEGs defined and identified in the meta-analysis from Aggregate 1 (top) and Aggregate 2 (bottom). |
Expression Data
Expression Detail
Antibody Labeling
Phenotype Data
Phenotype Detail
Acknowledgments
This image is the copyrighted work of the attributed author or publisher, and
ZFIN has permission only to display this image to its users.
Additional permissions should be obtained from the applicable author or publisher of the image.
Full text @ Comput Struct Biotechnol J