
FIGURE
Figure 6
Figure 6
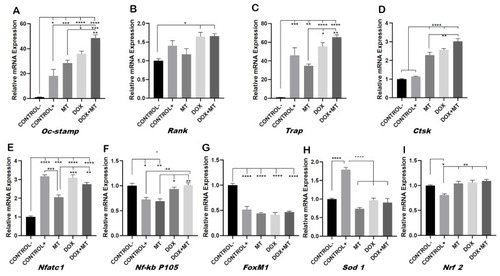
Effect of MitoTEMPO on doxorubicin-induced osteoclast differentiation and oxidative stress markers. RAW264.7 cells were cultured for 4 days with M-CSF (30 ng/mL) and RANKL (50 ng/mL) and treated with MitoTEMPO (MT) and Doxorubicin (DOX) alone or together. Levels of expression for Oc-stamp (A), Rank (B), Trap (C), Ctsk (D), Nfatc1 (E), Nf-kb p105 (F), FoxM1 (G), Sod1 (H) and Nrf 2 (I) were analyzed by qPCR. One-way ANOVA, Tukey?s multiple comparisons test, *?p ? 0.05, **?p ? 0.01, ***?p ? 0.001, ****?p ? 0.0001. |
Expression Data
Expression Detail
Antibody Labeling
Phenotype Data
Phenotype Detail
Acknowledgments
This image is the copyrighted work of the attributed author or publisher, and
ZFIN has permission only to display this image to its users.
Additional permissions should be obtained from the applicable author or publisher of the image.
Full text @ Int. J. Mol. Sci.