Fig. 4
- ID
- ZDB-FIG-221211-221
- Publication
- Taylor et al., 2022 - Prematurely terminated intron-retaining mRNAs invade axons in SFPQ null-driven neurodegeneration and are a hallmark of ALS
- Other Figures
- All Figure Page
- Back to All Figure Page
|
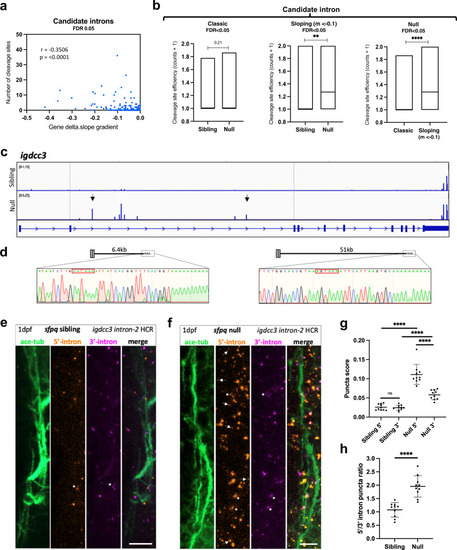
PreT-IR transcripts undergo cleavage/polyadenylation and neurite localisation in SFPQ-deprived neurons.
a Correlation between RNAseq read slope gradient in null and number of cleavage sites in introns of sloping IR-transcripts. Two-tailed Pearson correlation coefficient, r: ?0.3506, p < 0.0001 (n = 247 sloping IR-transcripts, FDR < 0.05). b Efficiency of cleavage site usage in classic (Left; (n = 107, FDR < 0.05)) and sloping (Middle; (n = 37, m < ?0.1, FDR < 0.05)) IR-transcripts in sibling and null samples. (Right) Efficiency of cleavage site usage in retained introns between classic versus sloping IR-transcripts in null samples. Floating bar plots where the middle represents the median and the upper and lower limits represent the maximum and minimum values. Two-tailed Mann?Whitney tests. (Left) p = 0.21, (Middle) **p:0.0076, (Right) ****p < 0.0001 (c) Positions of 3?mRNAseq read clusters along igdcc3 in 24 hpf sibling null embryo RNA samples, indicating sites of cleavage and polyadenylation. Peak height indicates relative usage of each cleavage site among transcripts of that sample. Dashed lines demarcate intron-2. Black arrows indicate peaks targeted by 3?RACE. d 3?RACE validation of igdcc3 3?mRNAseq results in (c) in null neurites. Sequencing of products shows terminal intronic sequences containing PAS consensus sequences (red boxes) and the start of a PolyA tail. (Left) exons 1?2 + 6.5 kb intron-2 and polyA. (Right) exons 1?2 + 51 kb intron-2 and polyA. e, f Confocal z-projections (10 ?m) of 1dpf (1 day post-fertilisation/24hpf) sfpq sibling (e) & null (f) embryo axons, and igdcc3 IR and PreT-IR transcripts. Probe sets target either the 5?-most (red) or 3?-most (magenta) 10 kb of intron-2. Axons running longitudinally just anterior to the otic vesicle. Asterisks: axonal RNAs labelled by both intron-2 probe sets. Arrows: axonal RNAs labelled by 5? intron-2 probe set only. RNA puncta are also present in neuronal cell bodies surrounding axons. Scale bars 10 ?m. g, h Quantification of 5? and 3? intron-2 puncta in axons in (e, f). Each datapoint represents a different embryo. N = 10 sibling and 10 null embryos. Two-tailed unpaired t tests with Welch?s correction, ****p < 0.0001. Means plotted with SD. Source data are provided as a Source Data file. |
| Fish: | |
|---|---|
| Observed In: | |
| Stage: | Prim-5 |

