Figure 3
- ID
- ZDB-FIG-221109-23
- Publication
- Blanc et al., 2022 - A dynamic and expandable Digital 3D-Atlas MAKER for monitoring the temporal changes in tissue growth during hindbrain morphogenesis
- Other Figures
- All Figure Page
- Back to All Figure Page
|
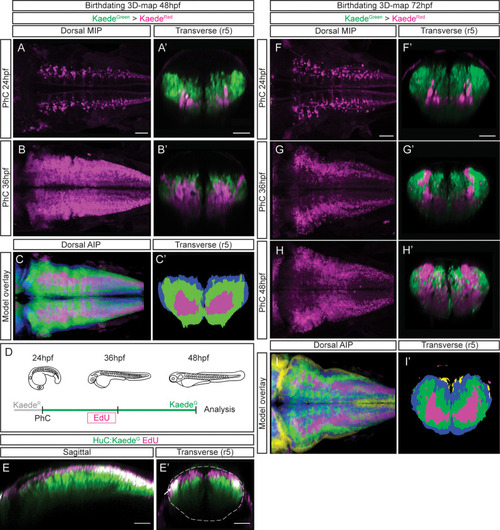
(A?B) Dorsal maximal intensity projections (MIP) showing only the HuC:KaedeRed, and (A??B?) transverse views through r5 displaying both HuC:KaedeGreen and HuC:KaedeRed at 48hpf. HuC:KaedeGreen was photoconverted at the indicated times (PhC). Note that HuC:KaedeRed is displayed in neurons born before the time of photoconversion, and HuC:KaedeGreen in neurons born after. (C?C?) Neuronal birthdate 3D-map at 48hpf resulting from the intersection of photoconversion 3D-models. Neurons produced before 24hpf are depicted in magenta, those produced between 24hpf and 36hpf are in green, and the blue regions display neurons produced between 36hpf and 48hpf (n=5 embryos each). (D) Scheme depicting the photoconversion experiment followed by EdU-treatment. HuC:KaedeGreen was photoconverted at 24hpf, embryos were let to develop, pulsed with EdU for 6hr at 30hpf, and imaged at 48hpf. (E?E?) Tg[HuC:KaedeGreen] embryo displaying EdU (magenta) and HuC (green) in sagittal and transverse views, respectively. Note that EdU-cells are within the most dorsal part of the hindbrain, specifically in the progenitor domain and in the dorsal HuC domain (E?, see white arrow). The contour of the neural tube in (E?) is indicated with a white dashed line. (F?H) Dorsal maximal intensity projections (MIP) showing only the HuC:KaedeRed, and (F??H?) transverse views through r5 displaying both HuC:KaedeGreen and HuC:KaedeRed at 72hpf. HuC:KaedeGreen was photoconverted at the indicated times (PhC). (I?I?) Neuronal birthdate 3D-map at 72hpf resulting from the intersection of photoconversion 3D-models. Neurons produced before 24hpf are depicted in magenta, those between 24 and 36hpf in green, the ones between 36 and 48hpf in blue, and neurons produced between the last photoconversion (48hpf) and the time of acquisition (72hpf) in yellow (n=5 embryos each). Dorsal and sagittal views display anterior to the left. Scale bar, 50?m.
|

