Figure S1
|
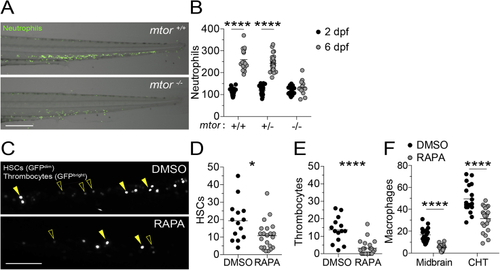
mTOR deficiency impairs hematopoiesis in zebrafish, related to (A) Overlaid widefield fluorescence and bright-field micrographs of an (B) Numbers of neutrophils in the caudal hematopoietic tissue (CHT) of animals from (C–F) Zebrafish embryos were manually dechorionated and treated with 400 nM rapamycin or 0.5% DMSO on 1 dpf to block primitive and intermediate waves of hematopoiesis ( (C) Confocal micrographs of the CHT of (D) Numbers of HSCs in the CHT of 2 dpf animals. (E) Numbers of thrombocytes in the CHT of 2 dpf animals. (F) Numbers of macrophages in the midbrain and CHT of Scale bars: 300 μm in (A) and 100 μm in (C). (B and D–F) Symbols represent individual animals. Horizontal lines indicate means. Statistical analyses, (B) two-way ANOVA with Tukey’s post-test and (D–F) unpaired Student’s t test. |
| Gene: | |
|---|---|
| Fish: | |
| Condition: | |
| Anatomical Term: | |
| Stage Range: | Long-pec to Day 6 |
| Fish: | |
|---|---|
| Condition: | |
| Observed In: | |
| Stage Range: | Long-pec to Day 6 |
Reprinted from Cell, 185(20), Pagán, A.J., Lee, L.J., Edwards-Hicks, J., Moens, C.B., Tobin, D.M., Busch-Nentwich, E.M., Pearce, E.L., Ramakrishnan, L., mTOR-regulated mitochondrial metabolism limits mycobacterium-induced cytotoxicity, 3720-3738.e13, Copyright (2022) with permission from Elsevier. Full text @ Cell

