|
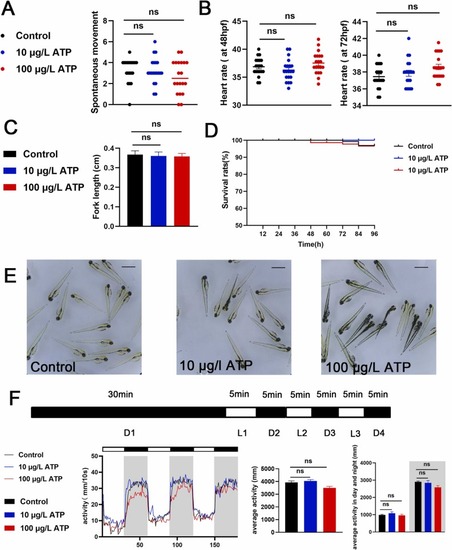
Fig. 1. Atropine had no significant effect on the growth, development and activity of zebrafish larvae. (A) Times of tail wagging of 30 hpf larval zebrafish (times/min, n = 15). (B) Heart rate of 48 hpf, 72 hpf larval zebrafish (times/20 s, n = 15). (C) Body length of 96 hpf zebrafish larvae (cm, n = 15). (D) 0?96 hpf larvae survival curve (%, n = 15). (E) Morpha of 96 hpf zebrafish under a stereomicroscope. (F) PMR behavior of zebrafish larvae monitored by Viewpoint (n = 16). ATP in the figure represents atropine, The analysis showed that there was no obvious difference between atropine and control group. (*P < 0.05, ** P < 0.01, ***P < 0.001, one-way ANOVA analysis, LSD for port-hoc test).
|