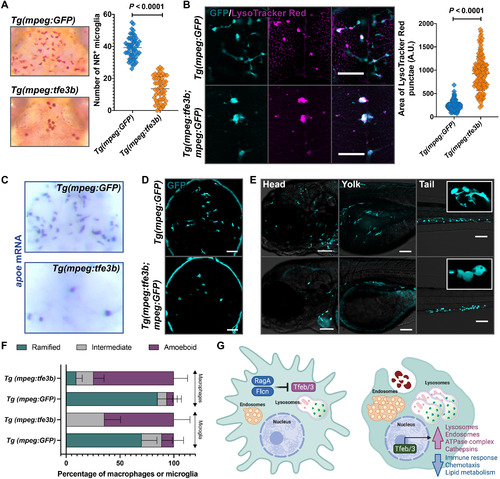
Fig. 6. Overexpression of tfe3b in the macrophage lineage disrupts microglia number and morphology as in rraga mutants. Comparison of macrophages and microglia between animals overexpressing Tfe3b in the macrophage lineage, Tg(mpeg:tfe3b), and controls, Tg(mpeg:GFP), using (A) neutral red assay and quantification and (B) LysoTracker Red assay and quantification. Graphs show mean + SD; significance was determined using parametric unpaired t test. (C) apoe in situ hybridization and (D and E) live imaging with the mpeg:GFP transgene in (D) the brain and (E) the head, yolk, and tail regions of Tg(mpeg:tfe3b) and Tg(mpeg:GFP) larvae. Insets show magnified views of cell morphology. (F) Quantification of amoeboid morphology of microglia and macrophages. Graph shows mean + SD; significance was determined using nonparametric Mann-Whitney U test. Scale bars, 50 ?m. The number of animals analyzed for each experiment is listed in table S1; all the panels are representative of at least two independent experiments. (G) Schematic summarizing the lysosomal regulatory circuit in microglia and macrophages.
|
