Fig. 5
- ID
- ZDB-FIG-220822-5
- Publication
- Gong et al., 2022 - LGP2 is essential for zebrafish survival through dual regulation of IFN antiviral response
- Other Figures
- All Figure Page
- Back to All Figure Page
|
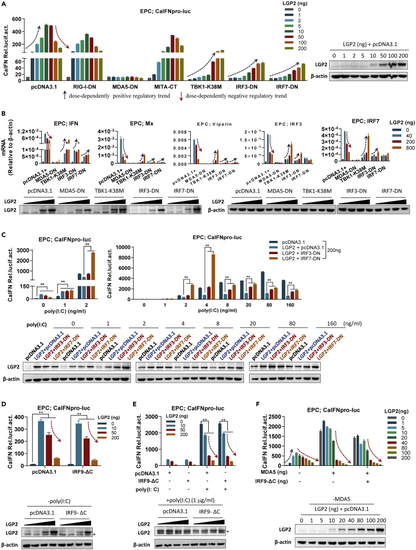
Function switch of LGP2 is related to IFN production but not to IFN signaling (A) Luciferase assay analyses of LGP2-triggered fish IFN promoter activation in the absence or presence of the indicated dominant negative mutants of RLR signaling molecules. EPC cells seeded in 24-well plates were cotransfected with CaIFNpro-luc, each of the indicated dominant negative plasmids (200 ng each), together with LGP2 at increasing doses for 48 h. (B) LGP2-directed mRNA expression of cellular genes was suppressed by functional blockade of RLR signaling. EPC cells seeded overnight in 6-well plates were transfected with each of the indicated dominant negative plasmids (800 ng), together with LGP2 at increasing amounts for 48 h, followed by RT-PCR detection of ifn, mx, viperin, irf3, and irf7 transcripts. (C) Antithetic effects of LGP2 on poly(I:C)-triggered fish IFN promoter activation in the absence or presence of IRF3-DN or IRF7-DN by luciferase assays. EPC cells seeded in 24-well plates were transfected with CaIFNpro-luc and LGP2, together with IRF3-DN or IRF7-DN (200 ng each) for 24 h, followed by transfection again with poly(I:C) at increasing concentrations (from 0 to 160 ng/mL) for another 24 h. (D?F) Function blockade of IRF9 did not impair LGP2-triggered negative regulatory trend in the presence of LGP2 self (D), poly(I:C) (E), and MDA5 (F). EPC cells seeded in 24-well plates were transfected as in (A) with the indicated plasmids for 24 h (D and F) followed by luciferase assays or transfected again with poly(I:C) (1 ?g/mL) for another 24 h (E) followed by luciferase assays. IRF9-?C and MDA5 was transfected at 200 ng. Western blot in (A?F) showed the ectopically expressed LGP2 in a dose-dependent manner by anti-LGP2 Ab, and it is noted that the endogenous LGP2 was also induced by poly(I:C) in (E). ?Nonspecific band. Data were shown as mean ± SD (N = 3). P values were calculated using Student?s t test. ??p < 0.01. See also Figure S4 and Table S1. |

