
Fig. 6
- ID
- ZDB-FIG-220822-23
- Publication
- Agarwala et al., 2022 - Defining the ultrastructure of the hematopoietic stem cell niche by correlative light and electron microscopy
- Other Figures
- All Figure Page
- Back to All Figure Page
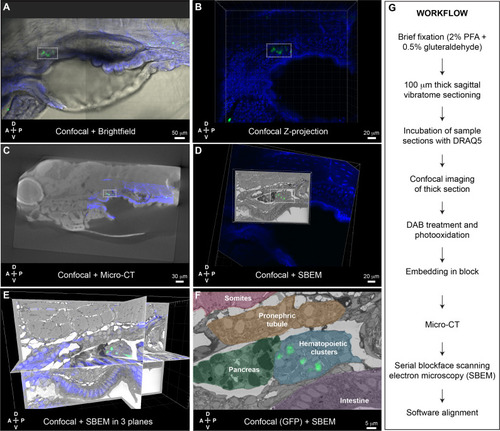
Correlative light and electron microscopy (CLEM) Workflow #2 to align all cd41:GFP+ hematopoietic stem and progenitor cells (HSPCs) in the larval kidney marrow (KM) niche.
Five days post fertilization (dpf) cd41:GFP+ HSPCs (green) and DRAQ5 nuclear dye (blue). (A-D) The same region of the KM niche is marked by a white dotted rectangle. (A) Confocal and brightfield image of thick vibratome section. (B) Confocal Z projection of thick vibratome section. (C) Aligned overlay of micro-computed tomography (microCT) and confocal data. (D) Aligned overlay of serial block-face scanning electron microscopy (SBEM) and confocal data (XY plane only). (E) Aligned overlay of SBEM and confocal data (XY, XZ, YZ planes). (F) Detail of single SBEM section with aligned overlay of cd41:GFP+ HSPCs. Anatomical features are labeled and color-coded. (G) Summary of processing steps used in Workflow #2. Abbreviations: D, dorsal; V, ventral; A, anterior; P, posterior. |