
FIGURE
Fig. 2
- ID
- ZDB-FIG-220819-53
- Publication
- Wang et al., 2021 - Transcriptome analysis of the early stage ifnlr1-mutant zebrafish indicates the immune response to auditory dysfunction
- Other Figures
- All Figure Page
- Back to All Figure Page
Fig. 2
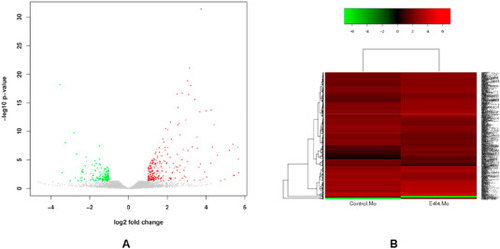
Fig. 2. The volcano plot and heatmap of DEGs. (A) The volcano plot of DEGs: up-regulated DEGs are shown in red and down-regulated DEGs are shown in green. (B) The heatmap of DEGs: up-regulated DEGs are shown in red and down-regulated DEGs are shown in green. . (For interpretation of the references to color in this figure legend, the reader is referred to the Web version of this article.) |
Expression Data
Expression Detail
Antibody Labeling
Phenotype Data
Phenotype Detail
Acknowledgments
This image is the copyrighted work of the attributed author or publisher, and
ZFIN has permission only to display this image to its users.
Additional permissions should be obtained from the applicable author or publisher of the image.
Reprinted from Gene expression patterns : GEP, 43, Wang, W.Q., Qiu, S.W., Huang, S.S., Wang, G.J., Han, M.Y., Kang, D.Y., Yuan, Y.Y., Gao, X., Dai, P., Transcriptome analysis of the early stage ifnlr1-mutant zebrafish indicates the immune response to auditory dysfunction, 119229, Copyright (2021) with permission from Elsevier. Full text @ Gene Expr. Patterns