
Fig. 4
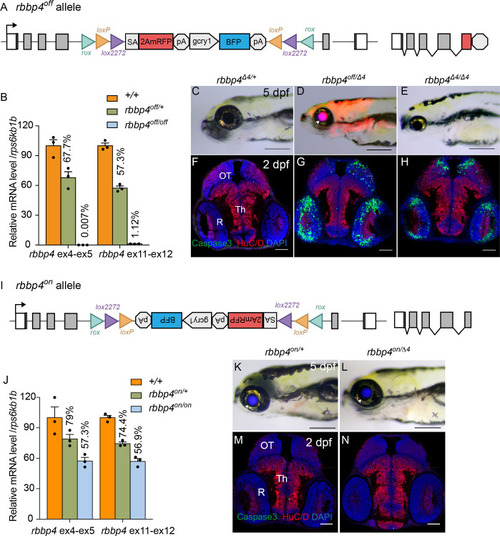
Molecular and phenotypic characterization of rbbp4off and rbbp4on alleles. (A) Diagram of the rbbp4off allele. (B) Plot of RT-qPCR results from wild type +/+ (n=3), heterozygous rbbp4off/+(n=3), and homozygous rbbp4off/off (n=3) larvae showing the relative level of rbbp4 mRNA transcript using reference gene rps6kb1b. Primer pairs were located in exons 4 and 5, or downstream exons 11 and 12. (C ? E) Gross phenotype of rbbp4?4/+ (C), rbbp4off/?4 (D), and rbbp4?4/?4 (E) 5 dpf larvae. Arrowhead in (D) points to overlap of rbbp4off 2A-mRFP primary reporter and gcry1:BFP secondary reporter expression in the lens, which appears purple. (F ? H) Caspase-3 and HuC/D labeling of sectioned head tissue from 2 dpf rbbp4?4/+ (F) rbbp4off/?4 (G) and rbbp4?4/?4 (H) embryos. (I) Diagram of the rbbp4on allele. (J) Plot of RT-qPCR results from wild type +/+ (n=3), heterozygous rbbp4on/+ (n=3), and homozygous rbbp4on/on (n=3) larvae showing the relative level of rbbp4 mRNA transcript using reference gene rps6kb1b. Primer pairs were located in exons 4 and 5, or downstream exons 11 and 12. (K, L) Gross phenotype of rbbp4on/+ (K) and rbbp4on/?4 (L) 5 dpf larvae. The rbbp4on allele secondary marker gcry1:BFP expression is visible in the lens. Caspase-3 and HuC/D labeling of sectioned head tissue from 2 dpf rbbp4?4/+ (M) and rbbp4off/?4 (N) embryos. OT, optic tectum; R, retina; Th, thalamic region. Error bars represent mean � s.e.m. Scale bars: 200 ?m (C?E, K, L), 50 ?m (F?H, M,N).
|