
FIGURE
Fig. 6
- ID
- ZDB-FIG-220615-26
- Publication
- Li et al., 2022 - Systematic Characterization of the Disruption of Intestine during Liver Tumor Progression in the xmrk Oncogene Transgenic Zebrafish Model
- Other Figures
- All Figure Page
- Back to All Figure Page
Fig. 6
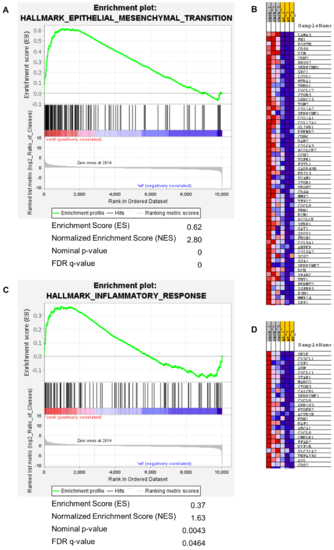
Figure 6. Gene set enrichment analysis of hallmark gene sets epithelial mesenchymal transition and inflammatory response. (A) GSEA summary plot of epithelial mesenchymal transition gene set comparing xmrk intestine to wt intestine. The gene set was highly enriched and upregulated: normalized enrichment score (NES) = 2.80, FDR q?value < 0.0001. (B) Heatmap of leading edge subset genes within the epithelial mesenchymal transition gene set (red: high expression; blue: low expression). (C) GSEA summary plot of inflammatory response gene set comparing xmrk intestine to wt intestine. The gene set was enriched and upregulated: NES = 1.63, FDR q?value = 0.0464. (D) Heatmap of leading edge subset genes within the inflammatory response gene set (red: high expression; blue: low expression).
|
Expression Data
Expression Detail
Antibody Labeling
Phenotype Data
Phenotype Detail
Acknowledgments
This image is the copyrighted work of the attributed author or publisher, and
ZFIN has permission only to display this image to its users.
Additional permissions should be obtained from the applicable author or publisher of the image.
Full text @ Cells